





 Oğuzhan Altun
12 min read
What is Google Trends and how do you use it? A trend analysis guide
What Google Trends is, what its 0–100 score means, Trending now, YouTube and Shopping filters, comparisons, seasonality, content calendars and its proper use in keyword research.Pro
Contents 17 sections
Key takeaways
- Google Trends is a free Google tool showing relative search interest over time and by region.
- The Trends score measures relative interest, not search volume, with the chart's peak set at 100.
- Google's help page says each data point is divided by total searches for its region and time range.
- A Breakout label means a rising query's interest grew by more than 5,000 percent in the selected period.
Google Trends is a free Google tool that shows how much a term or topic is searched on Google over time and by region, as a relative score from 0 to 100. It works at trends.google.com without signing in and shows search interest from 2004 to today, plus searches rising right now.
This guide is for curious readers and marketing teams alike: what the 0–100 score does and does not tell you, trending searches in a country, terms versus topics, the YouTube, Images, News and Shopping filters, comparisons, seasonality and content calendars, then keyword research, export, the API and the data’s limits. Data and feature details come from the Google Trends Help Center, Google’s Trending Now announcement and the Google Search Central blog.
Google Trends shows relative interest, not search volume; decisions are made together with a tool that gives volume and the business’s own sales data.
What is Google Trends?
Google Trends is an analysis tool that uses a sample of Google searches to show how interest in a topic changes over time and where it is strongest. It gives no exact search counts; it makes interest comparable by dividing it by total searches in the same period and region.
Trends has two main sections. In “Explore”, you type one or more terms and see interest over time, interest by region, related topics and related queries. “Trending now” lists topics whose searches have risen sharply in the past few hours in a country. One looks at direction, the other at the present.
What does the 0–100 score in Google Trends mean?
The score in Trends is a term’s : the highest point on the chart is 100, and a point with half that interest is 50. According to Google’s help page, each data point is divided by total searches for that region and time range, and the result is scaled from 0 to 100.
An important consequence: the region with the most searches does not always score highest. If a topic makes up a larger share of all searches in a small province, that province can outscore Istanbul. The score answers “what share of searches were about this topic”, not “how many people searched”.
What does Google Trends not show?
Google Trends is not a poll or an exact counter; Google’s help page states plainly that Trends data is not a perfect mirror of search activity and should be used with other data, not on its own to draw conclusions. Being searched a lot does not mean being liked or winning.
According to the help page, Trends leaves out these searches:
- Very low-volume terms → Without enough searches, the chart shows “0”.
- Repeated searches → Repeated searches by the same person in a short period are filtered out.
- Queries with special characters → Queries containing characters such as apostrophes are excluded.
- Searches by Google products → Queries generated by Google services, including background searches by AI Mode and AI Overviews, are not counted.
- Unusual activity → Most automated (bot) searches are filtered out.
Google also adds statistical noise to protect privacy, most noticeable for low-volume terms; a one-off spike may be noise rather than a real rise.
How do you use Google Trends? Step by step
To use Trends, open trends.google.com, type a term in “Explore” and choose a country and a time range; the chart and regional map appear instantly. This is our order for a first analysis:
- 1. Type the termType the term into the search box at trends.google.com; if the suggestions include an option labelled “Topic”, consider choosing it.
- 2. Choose the countryPick the country from the location menu at the top; drill down to region level from the same menu if needed.
- 3. Choose the time rangeChoose “Past 5 years” for direction, “Past 7 days” or “Past 30 days” for current events.
- 4. Choose the search typeThe default is Web Search; switch to YouTube, Image, News or Google Shopping from the menu.
- 5. CompareAdd a second and third term with “+ Compare”; scores are now scaled against each other.
- 6. Go deeperCheck the regional map and the “Related topics” and “Related queries” lists at the bottom.
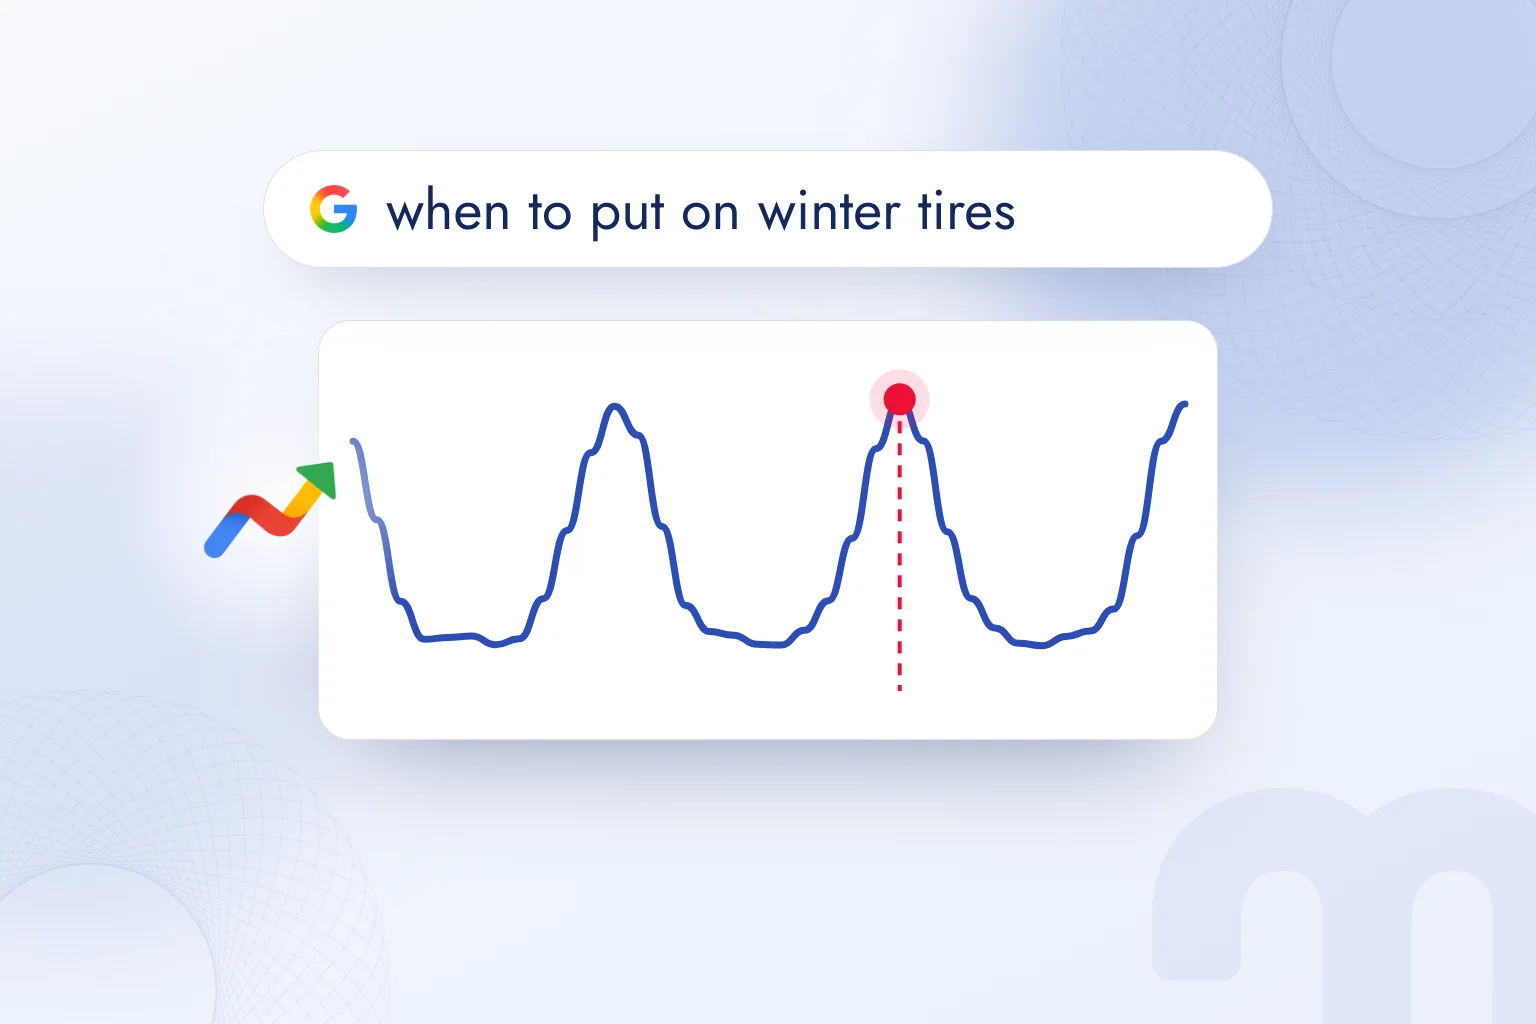
Search term or topic?
Trends offers two options: a “search term” counts only searches for the exact words typed, while a “topic” groups different spellings of a concept, its equivalents in other languages and close phrases. To measure general interest in a brand or product, choose the topic; to measure one specific phrase, choose the search term.
For example, the “London” topic counts “london”, “london weather” and the French “Londres” together; the “london” search term counts only searches containing that word. For choosing keywords the search term is more accurate; for measuring market interest, the topic.
How do you compare several terms?
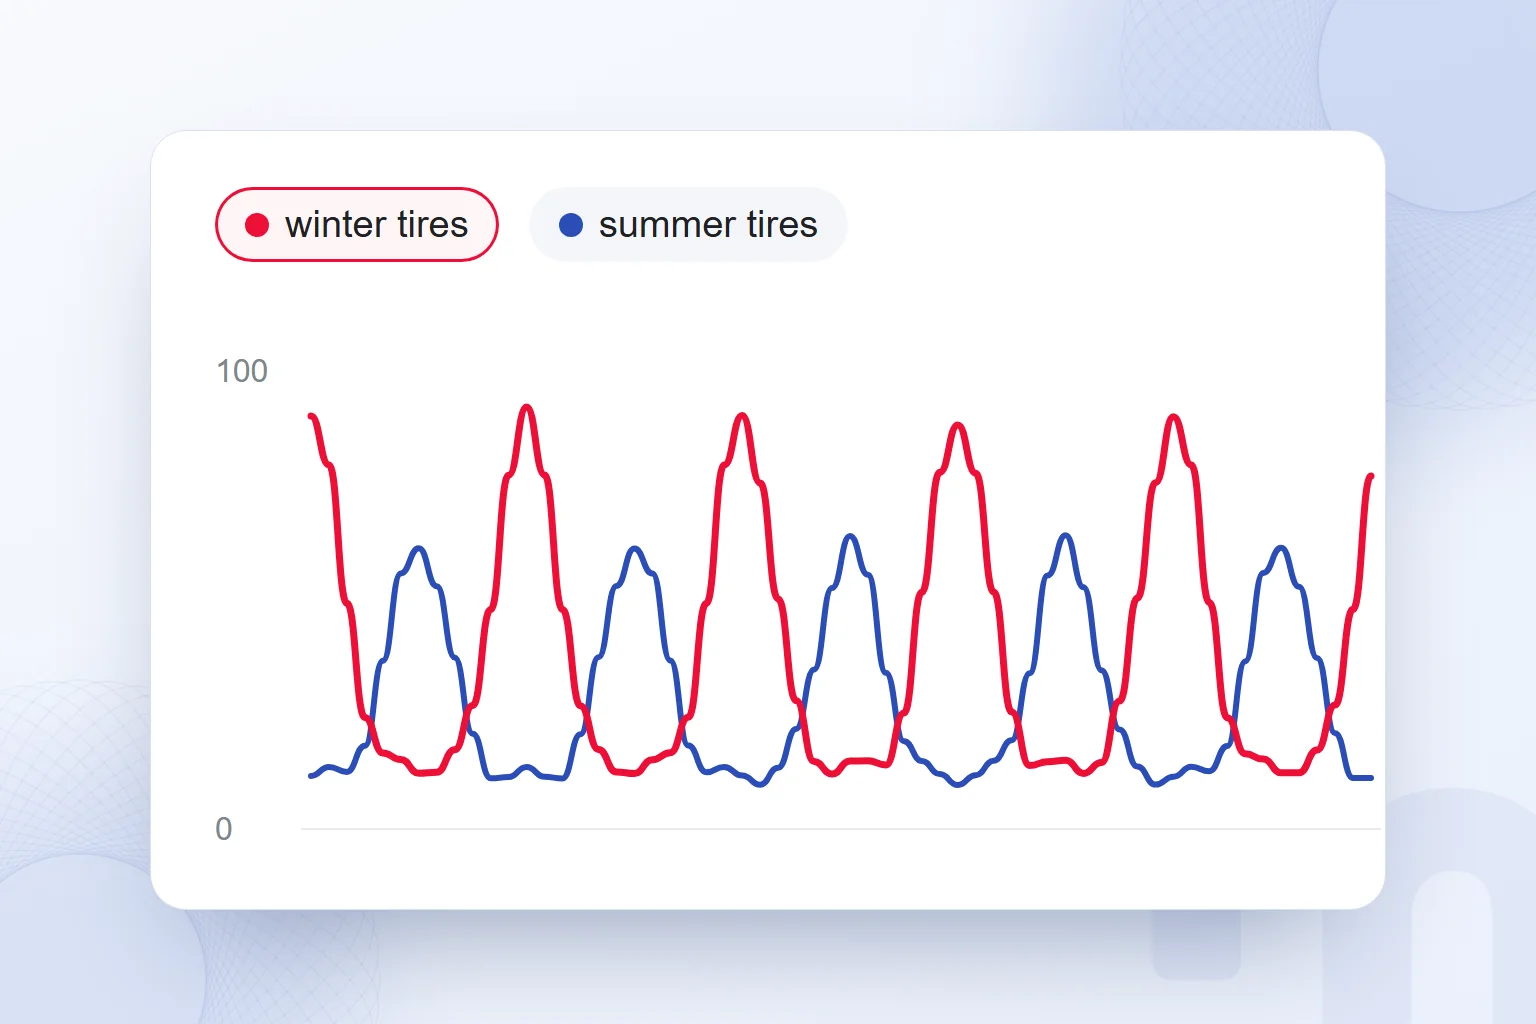
With “+ Compare”, up to five terms or topics are added to one chart on the same scale: the highest point becomes 100 and the rest are scaled to it. This lets you compare interest in “heater” and “air conditioner” across the year, or the popularity of two product models.
One caveat: next to a high-volume term, a low-volume one may look close to zero, so it is also examined on its own.
How do you track what is trending now on Google Trends?
To see searches rising in a country now, open “Trending now” and choose that country; the list shows when each trend started and how long it has been rising. According to Google’s August 2024 announcement, the page refreshes every 10 minutes on average and catches 10 times more rising trends than the previous version.
Each trend shows its start time, related news and a small search chart. Filters set the time range (past 4 hours, 24 hours, 48 hours or 7 days), the category and whether to show only active trends; trends can be compared side by side and the data exported. In Turkey, choosing Turkey as the location shows what is rising across the country at that moment.
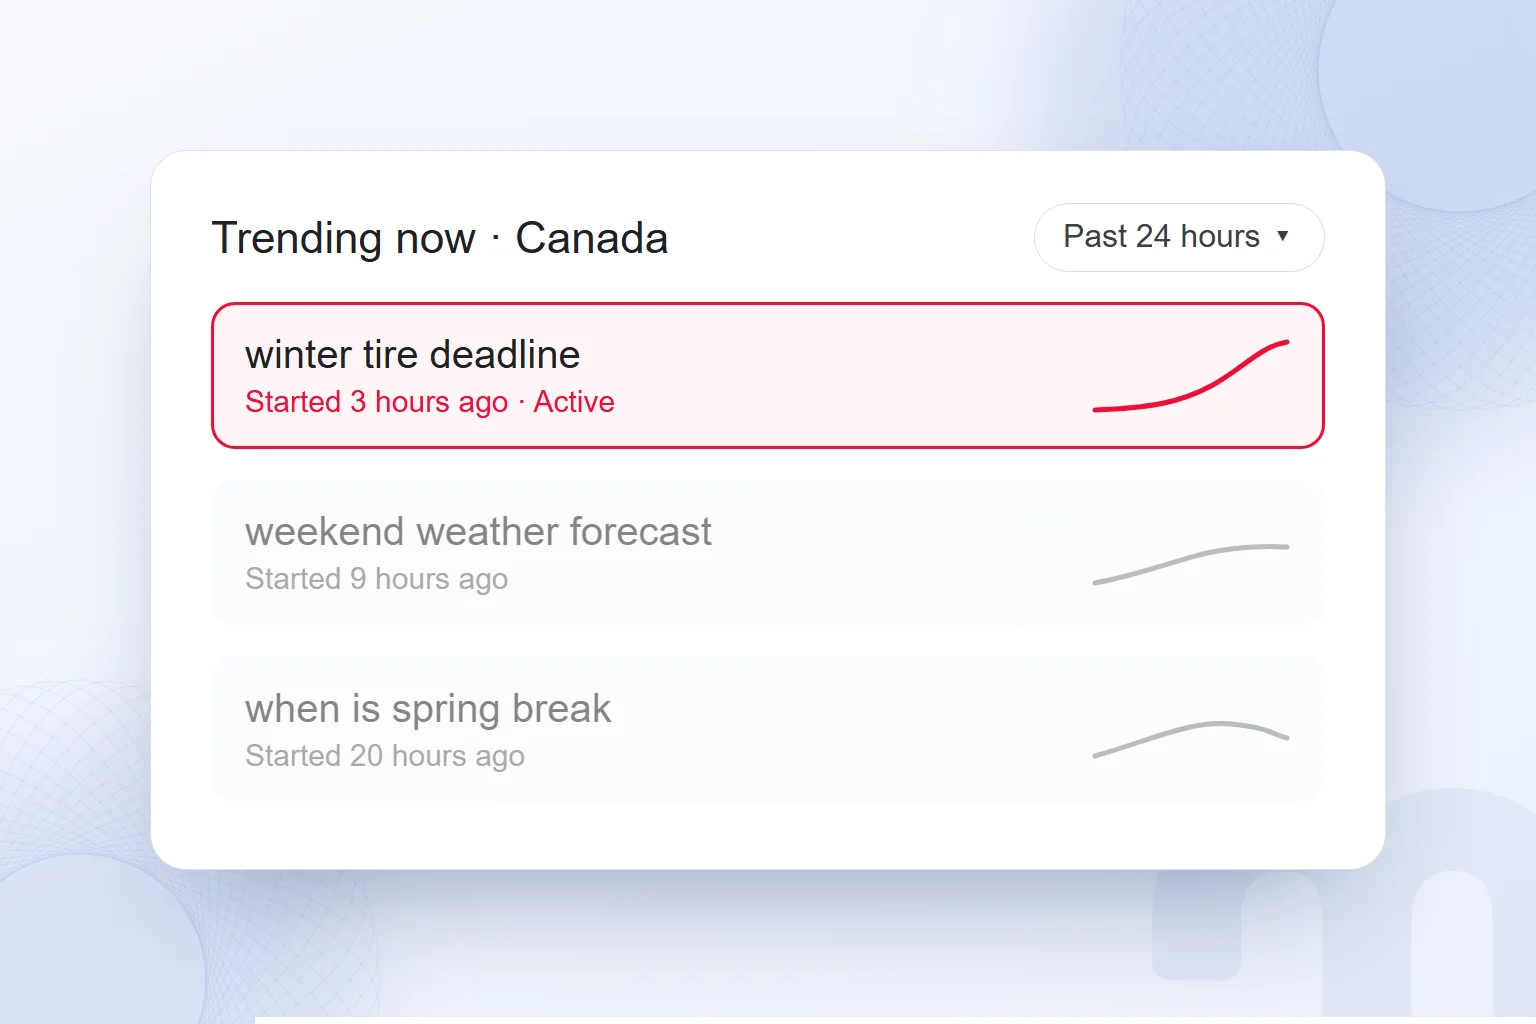
For a marketing team, this is the fastest way to follow the news cycle. A new regulation, a weather event or a product launch shows up in searches within hours; whether a brand responds with a guide, an announcement or a social post starts here. How timely content can stand out in Google Discover is covered in our what is Google Discover article.
YouTube, Image, News and Shopping filters in Google Trends
Besides Web Search, Trends shows interest in the same term separately for YouTube, Google Images, Google News and Google Shopping searches, chosen from the search type menu above the chart. Curves can differ sharply by search type.
| Search type | What it shows | When we use it |
|---|---|---|
| Web Search | General interest on Google | Choosing keywords and topics |
| YouTube Search | Search interest on YouTube | Choosing video and Shorts topics |
| Image search | Interest on Google Images | Design, decor and fashion topics |
| News search | Interest on Google News | Tracking news and crises |
| Google Shopping | Interest in shopping searches | Product demand and campaign timing |
These filters are what “Google Trends YouTube” and “Google Trends Shopping” searches are after. A recipe topic may draw a flat line all year in Web Search yet jump on YouTube before a holiday; that difference decides whether the content should be an article or a video.
How do you read interest by region and related queries?
The regional map below the chart shows where a term is searched relatively more; the “Related queries” list ranks queries searched alongside it in two ways, “Top” and “Rising”. Content ideas and local campaign decisions often start here.
If a query in “Rising” shows “Breakout” instead of a percentage, by Google’s definition its interest grew by more than 5,000 percent in the selected period; usually a new product, rule or event is behind it. “Top” shows lasting interest and forms the backbone of a keyword list. “Related topics” works the same way but shows concepts instead of queries: seeing which brands, materials or uses are searched next to a product helps plan content headings and product filters.
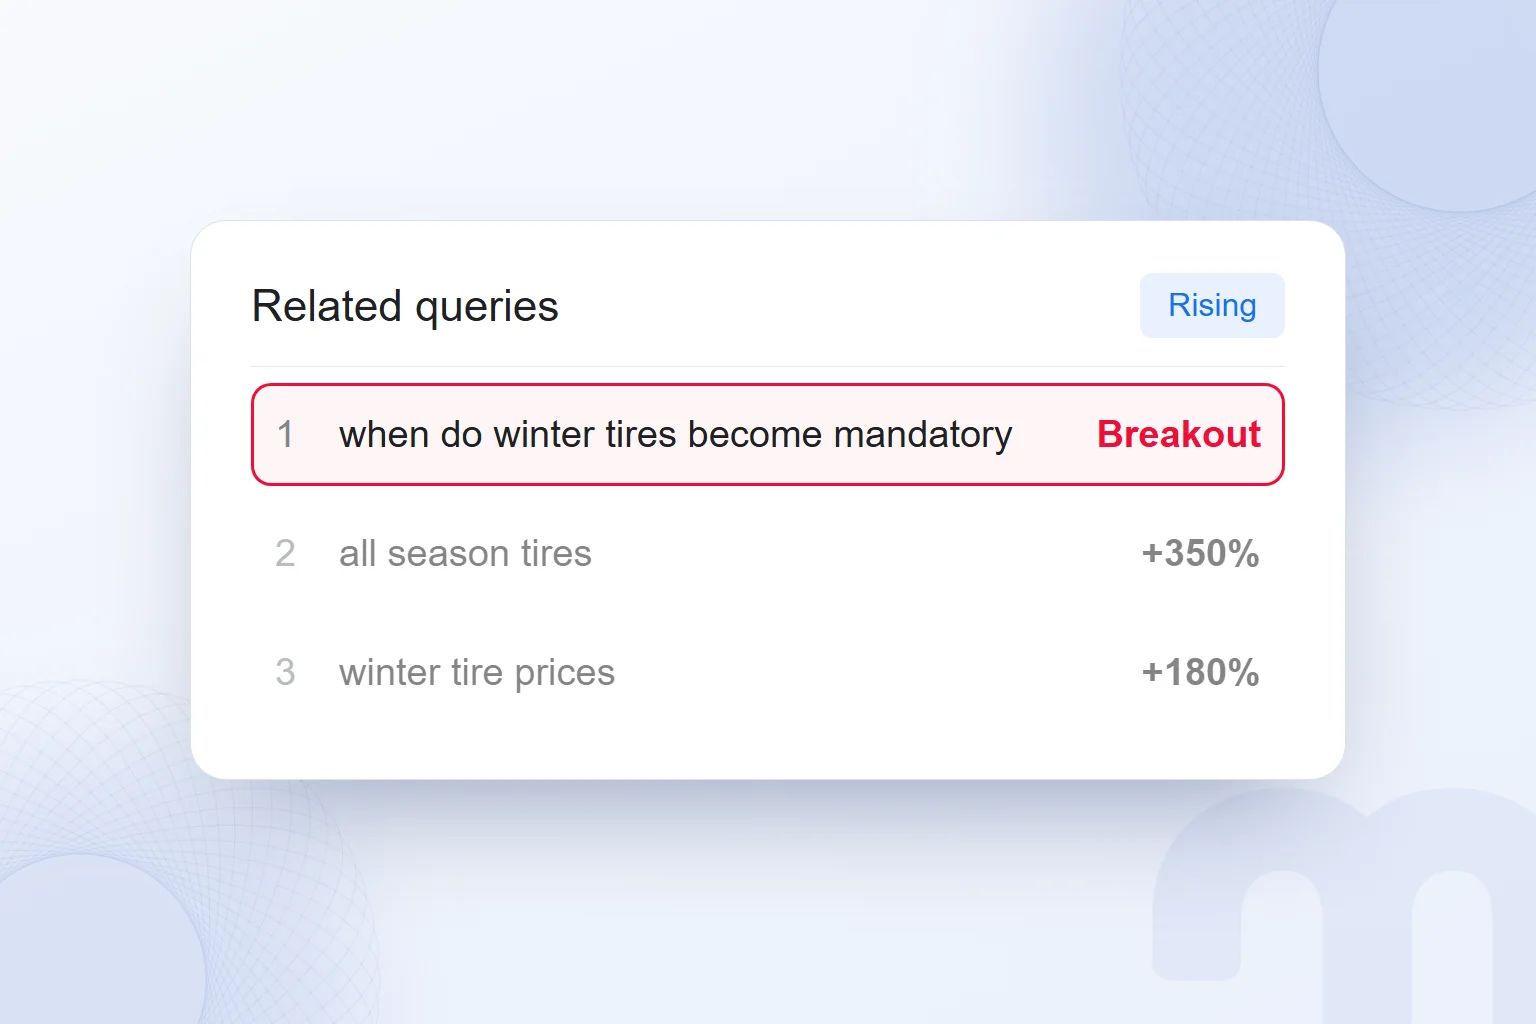
The same scaling logic applies to the map: it shows each region’s share, not its total searches. When splitting a local campaign budget by region, the map gives direction, but the decision also weighs population, sales data and the ad platform’s own estimates. We describe local visibility work on our local SEO page.
How do you do keyword research with Google Trends?
In keyword research, Trends shows direction, not volume: which phrase is rising, which is falling and in which month it peaks. To learn how many people search, a volume tool such as Google Ads Keyword Planner is used alongside the direction Trends shows.
The decision depends on what the two tools say together:
| Situation | What we do |
|---|---|
| High volume, rising Trends curve | Priority topic; we write a comprehensive guide and consider ads too |
| High volume, falling Trends curve | The content is updated, but new investment is made with care |
| Low volume, “Breakout” in Trends | A new need is emerging; we aim to rank early with early content |
| Low volume, flat Trends curve | We answer it as a long-tail phrase inside a related guide |
| Two synonymous phrases | We compare them in Trends and use the rising phrase in the heading |
Comparing synonyms is one of the most practical uses of Trends: “furnace maintenance” or “furnace repair”, “sweatpants” or “joggers”? The same need is searched with different words, and this comparison settles the heading. The general method of keyword selection is in our what is a keyword article, and its advertising side in our what is Google Ads guide.
How do you read seasonality and build a content calendar?
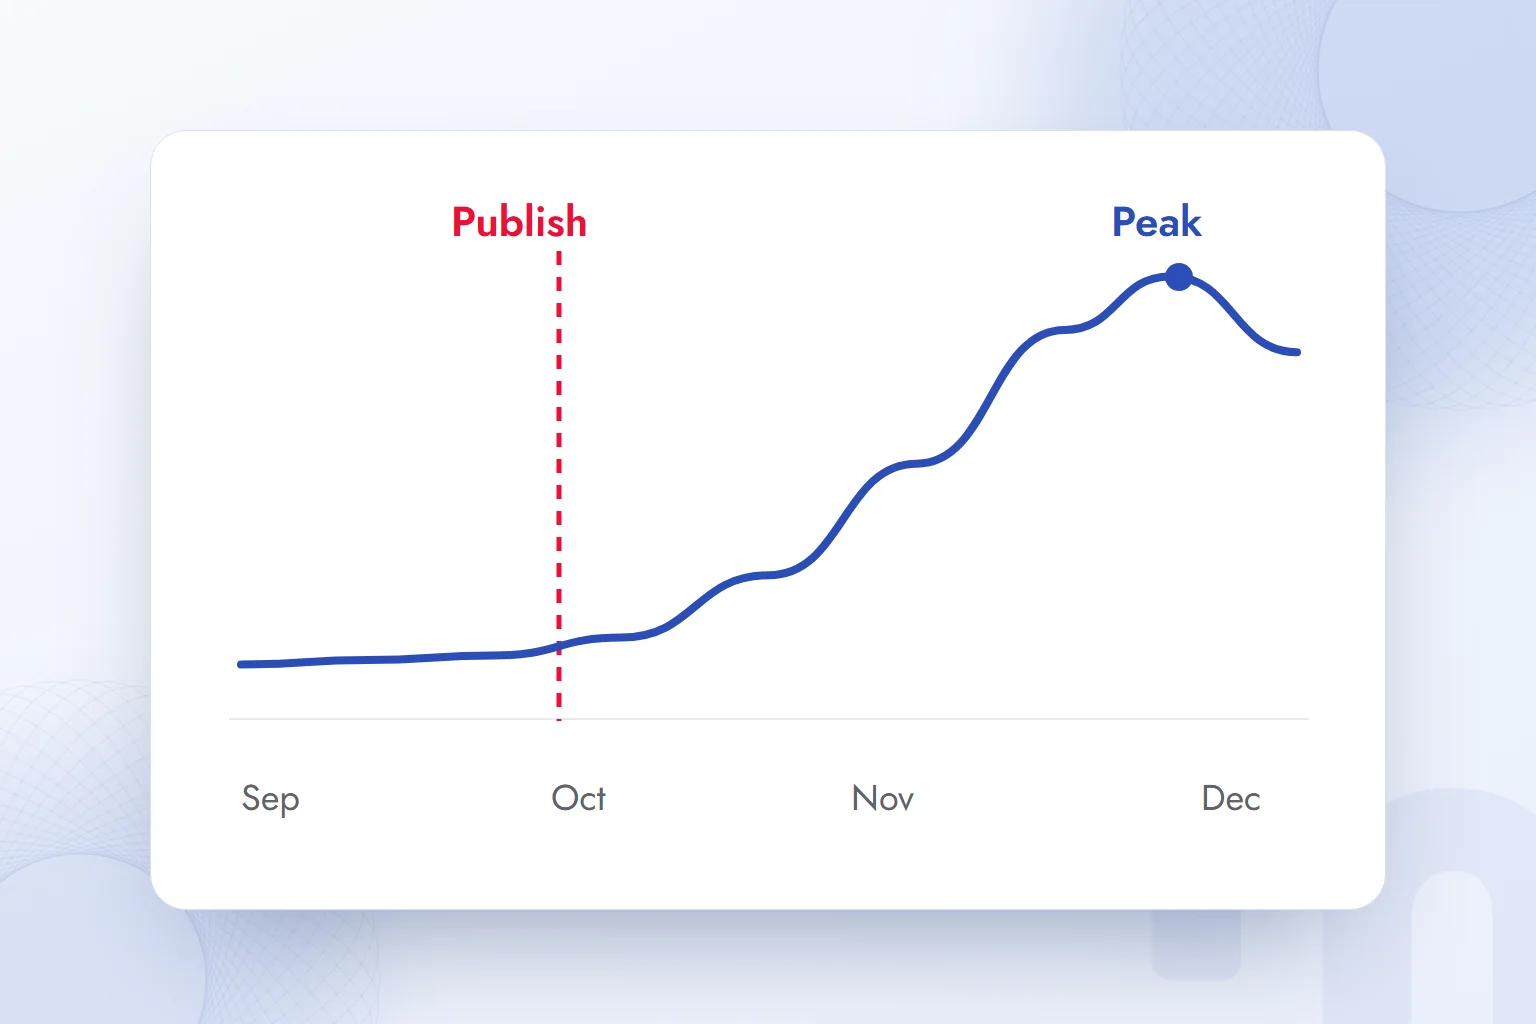
To see , set the time range to “Past 5 years” and check whether the curve peaks in the same months each year; regularly repeating peaks are the skeleton of a content and campaign calendar. Five years keeps one unusual year from distorting the decision.
Seasonal content must be live before the peak; Google needs time to discover, index and rank a page, so peak-month content often misses it. We turn a Trends curve into a calendar in this order:
- Find the peak month → We mark the month with the highest interest over the past five years.
- Find the week the rise begins → We note the week the curve lifts off its base; the content must be live before it.
- Plan backwards → We set a publish date at least six to eight weeks before the rise for a new guide, two to three weeks before for an update.
- Tie ads to the curve → We raise the ad budget in the rising weeks and lower it after the peak.
Product and market research with Google Trends
Trends gives product and market decisions their first data: whether demand is growing, where it is concentrated and which features it is searched with. For e-commerce teams, the Google Shopping filter is most valuable: it separates product search interest from Web Search.
In market research we use Trends with these questions:
- Is demand growing? → A rising five-year curve means an expanding market; a flat or falling one means a shared market.
- Which feature stands out? → Color, material, size and price phrases in “Related queries” shape product descriptions and filters.
- Brand or product? → If category searches grow faster than branded ones, users are not yet attached to a brand; there is room to enter with content and ads.
- Which foreign market? → Comparing interest in the same product across countries gives a first signal for export priorities.
Comparing competing brands follows the same logic: relative interest in two brands’ searches signals how memorable they are, not market share. The other steps are in our how to do competitor analysis article.
What is Year in Search?
Year in Search is the list Google publishes for each country at the end of every year, showing the searches that rose most compared with the previous year; it is published for Turkey too and reads as the annual summary of Google Trends. The lists are usually split into news, people, movies and TV shows, recipes, “how to” and “what is”.
The measure is “rising most”, not “searched most”: top searches barely change, rising ones tell the year’s story. For marketing teams, the “how to” and “what is” lists are an early map of new needs for next year’s content plan.
Can you use Google Trends on a phone?
Google Trends has no separate phone app; trends.google.com opens in a mobile browser, and Explore, comparison and Trending now work the same way. Detailed comparisons are easier on a computer; a bookmarked Trending now page allows a few-second check during the day.
How do you export Google Trends data? The Trends API
The download icon at the top right of every Trends chart saves the data as a CSV file to combine with other data in a spreadsheet or reporting tool. For regular reports, the same terms are downloaded monthly.
On 24 July 2025, Google announced the alpha version of the Google Trends API on the Google Search Central blog. According to the announcement, the API provides consistently scaled data for the past 1,800 days (about five years); because it is not rescaled to 0–100 on every request as on the website, data from different requests can be combined and compared. The data reaches up to two days before the present. The alpha opened to a limited number of developers by application.
A dashboard combining Trends, Search Console and sales data compares seasonality with your own results most easily. We build such dashboards in our Data Studio reporting work.
How reliable is Google Trends data?
Trends data is reliable for direction and timing, but it should not be read as an exact count, a market share or a measure of public opinion. Google’s help page states plainly that the data comes from a sample, that noise is added for privacy and that it is not a scientific poll.
The most common mistakes in reading a Trends chart, and the correct readings:
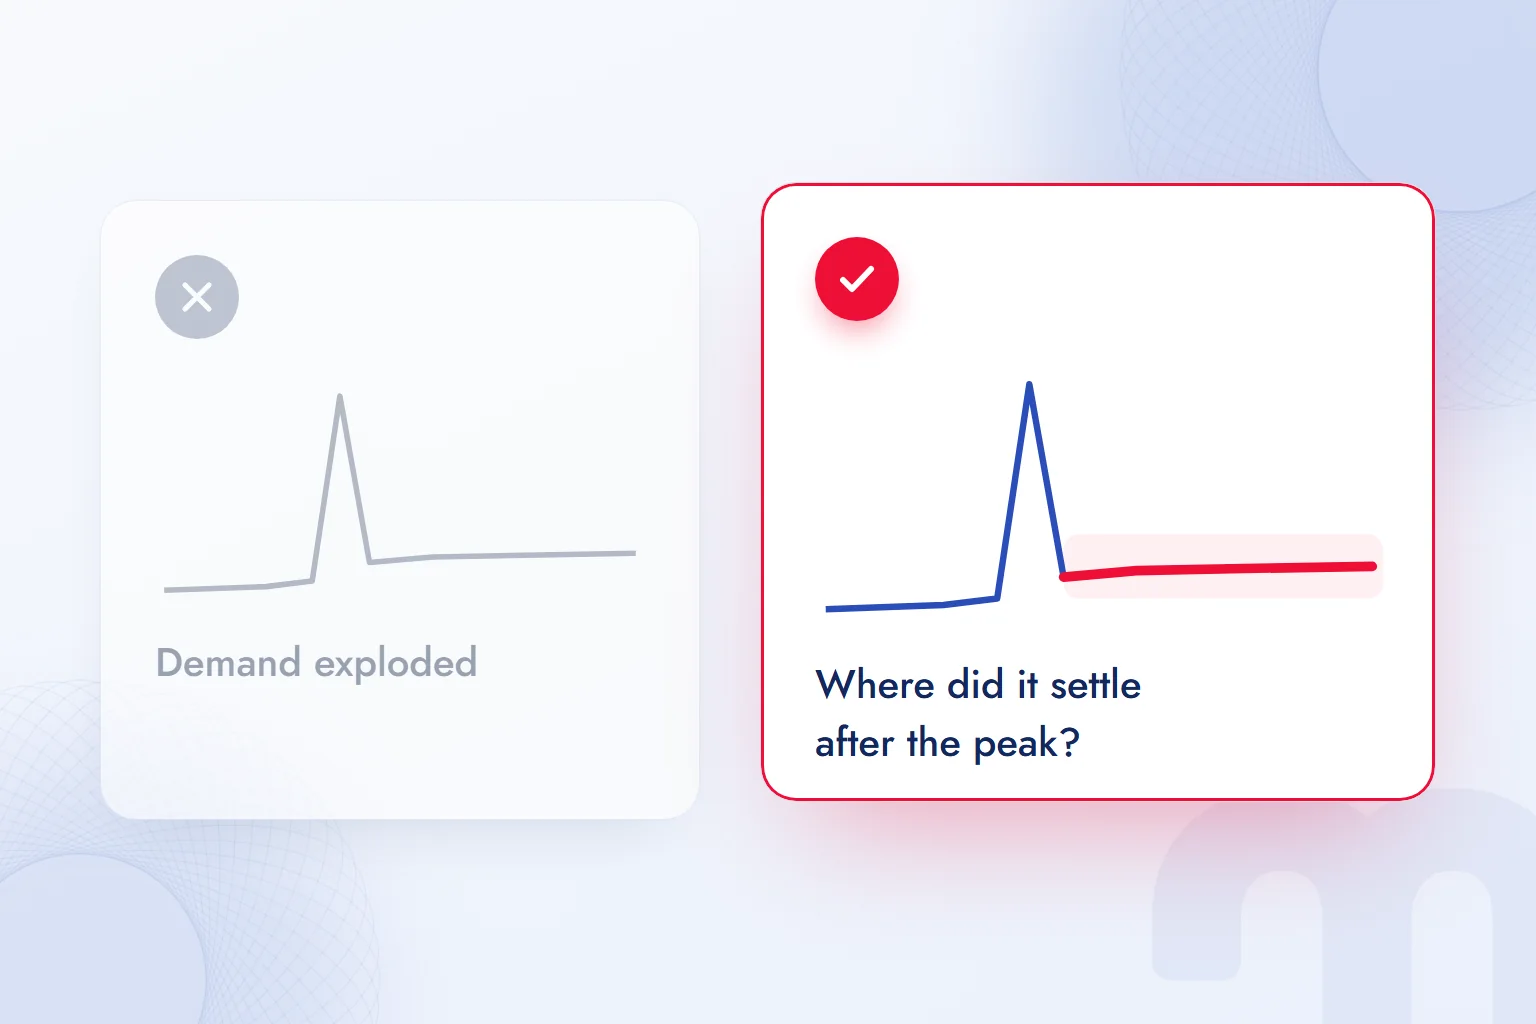
- Taking a spike as lasting → A one-day peak is usually a news story’s effect; for lasting interest, look at where the curve settles afterwards.
- Taking 100 as high volume → 100 is only the chart’s highest point; a low-volume term also reaches 100 on its own chart.
- Taking a region score as volume → A dark color on the map means searches make up a high share within that region, not that most searches happen there.
- Mixing up time zones → According to Google, ranges of 30 days or more are shown in UTC and ranges of 7 days or less in local time; hourly comparisons account for this.
Trends is the first input for organic marketing decisions; it creates value when content calendar, product page priorities and campaign timing are planned together. We carry out this planning in our organic marketing and SEO consulting work. For Google’s other tools, browse our SEO guides.
Frequently asked questions
Is Google Trends free?
Yes. Google Trends is free and is used at trends.google.com without signing in.
Does Google Trends show search volume?
No. Trends shows relative interest from 0 to 100; for search counts, a tool such as Google Ads Keyword Planner is used.
What does 100 mean in Google Trends?
It is the point of highest interest for the selected term, region and time range. Other points are scaled to it.
How do you see trending searches in a country?
Open “Trending now” in Trends and choose the country as the location. The list refreshes every 10 minutes on average.
Can you see YouTube searches in Google Trends?
Yes. Choose “YouTube Search” from the search type menu above the chart; the same menu covers Image, News and Shopping.
How many terms can you compare in Google Trends?
Up to five terms or topics can be compared on one chart, all on the same scale.
How far back does Google Trends data go?
In Explore, data starts in 2004. The alpha Trends API provides the past 1,800 days on a consistent scale.
What does “Breakout” mean in Google Trends?
In related queries, “Breakout” means interest in that query grew by more than 5,000 percent in the selected period.

 How to use Google advanced search: a search operators tableRead article
 What is Google Discover? Turning it on, off and getting trafficRead article
 What is Google Lens? How to use it to translate, shop and search on PCRead article
 How to do a Google image search on your phone and computerRead article
 What is Google Scholar and how to use it? Articles, citations, profileRead article
 Google Business Profile: how to add your business to Google MapsRead article
 WordPress SEO plugins: Yoast vs Rank Math vs AIOSEO comparedRead articleMost read
 What is a meta description? Length, writing rules and effect on clicksRead article
Questions & answers
0 commentsNo questions yet; you can ask the first one.