





 Cihat Murat Yüksel
18 min read
Contents 16 sections
Key takeaways
- A presentation delivers one key message to an audience through an opening, a body and a close.
- TUBITAK caps titles at 32 pt and slides at 60 words for presentations given on its behalf.
- Microsoft recommends text of at least 18 pt for accessible presentations.
- Full presentation creation with Gemini in Google Slides works only on desktop and only in English.
A presentation is the delivery of a message to an audience through various means; to work out how to make a presentation, we first get to know the audience, choose a single and arrange the content as opening, body and close.
At markention, proposal and marketing presentations start from the client’s situation and end with the next step we recommend. AI output is an outline for us; for content we follow the standards of TUBITAK, Turkey’s national research council, and for readability Microsoft’s accessibility recommendations. The message comes before the tool; a data check and a rehearsal come last.
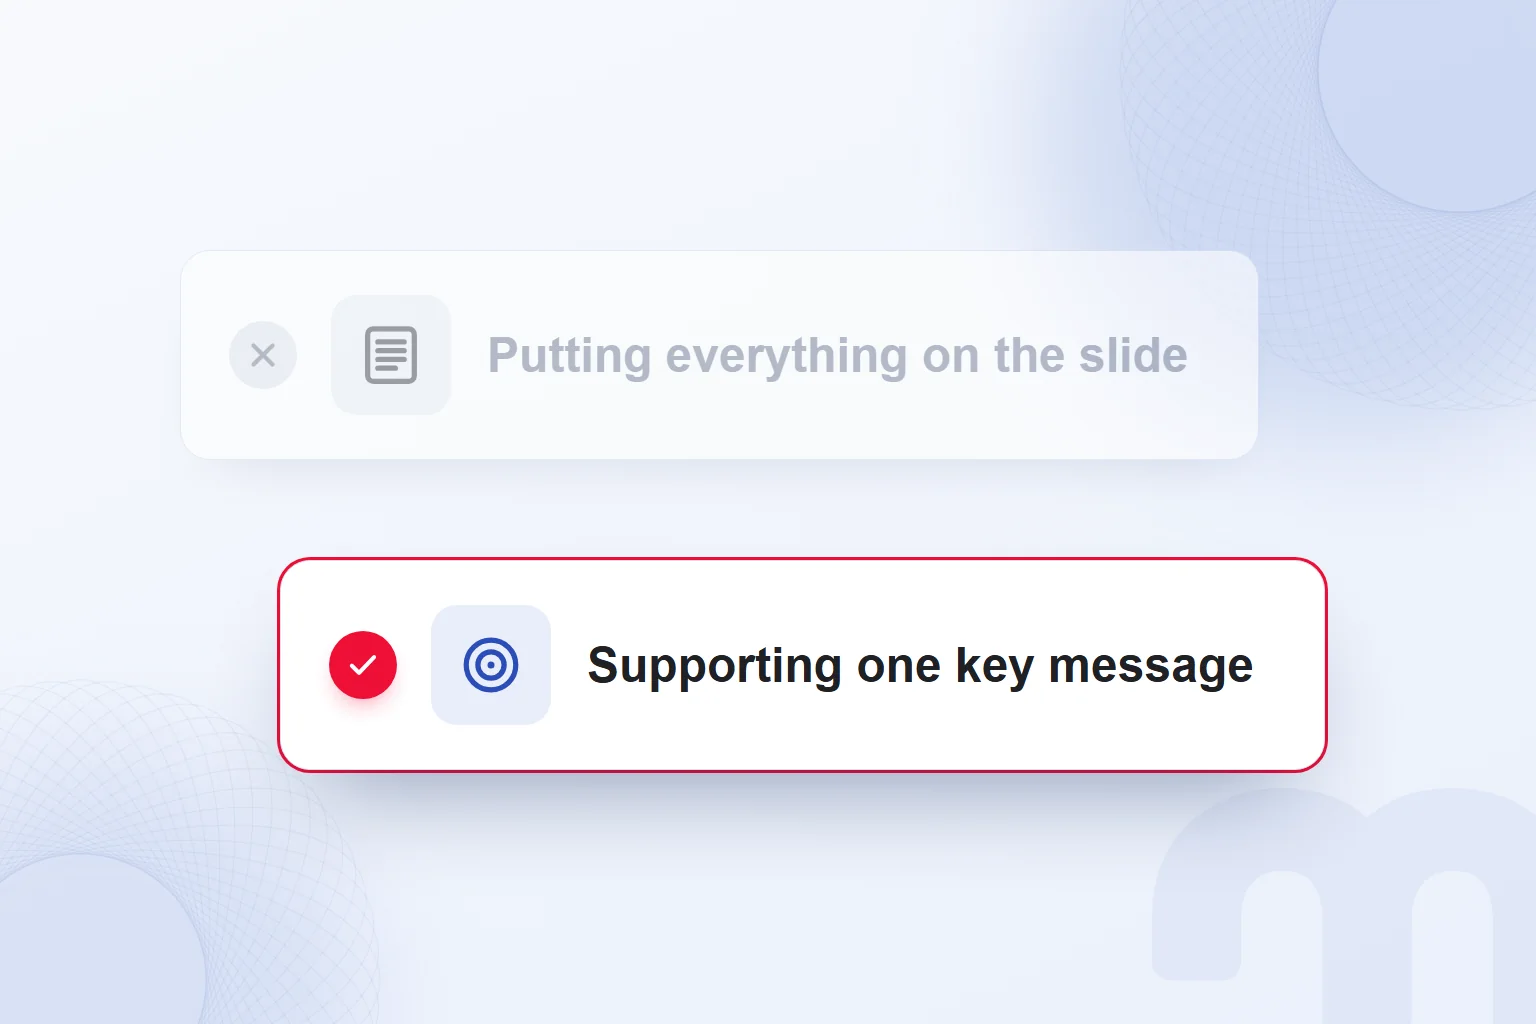
Each slide supports one key message; information that does not serve that message is removed from the presentation.
What is a presentation?
A presentation is the act of presenting, and the delivery of a message to an audience through various means; these are the two senses in the Turkish Language Association’s dictionary (TDK), which also lists “promotional presentation”. We build it as a whole covering our purpose, our information and the step we expect.
The dictionary defines a slide as an image prepared on a computer for a projection device; every page we project is a slide. Slides support the talk; we never copy everything we say onto the screen, and we choose each slide’s content by the idea the audience should grasp at that moment.
According to TUBITAK’s “Handbook for Effective Presentations”, a presentation aims beyond informing: to persuade, to introduce something new, or to change attitudes and behaviour. We set this purpose at the start and tie every part of the content to it.
Where do you start when making a presentation?
We start by defining who the audience is, why the topic matters to them and what should change after the presentation. The answer to “Why am I giving this presentation?” becomes a one-sentence key message, the yardstick for choosing what goes in.
A preparation note lists the audience, purpose, time and expected step side by side. If a proposal meeting aims to agree on scope, every section feeds that decision; introductory explanation is kept apart from supporting findings. Ordering headings against this note shows what is missing and what is unnecessary.
In the first draft we write the sentence each page will say instead of decorating slides. Repeating pages are sharpened or merged, and a heading unrelated to the key message goes. This is the same starting point for a deck built by hand in PowerPoint and for notes given to an AI tool.
The in TUBITAK’s handbook says that adding everything interesting devalues the important information. We judge each item by its meaning for the audience and its link to the key message; relevance alone does not earn a detail its place.
The handbook’s clarity standard: 99% of the audience understands 90% of the presentation. We apply it to technical terms, foreign expressions and abbreviations, and explain every unfamiliar concept before moving on.
The decision depends on the situation:
- The audience is new to the topic → we explain terms with everyday concepts and spell out abbreviations.
- The audience will make a decision → we state clearly, at the end, the step we expect from them.
- We have too much information → we remove whatever does not support the key message.
What are the parts of a presentation?
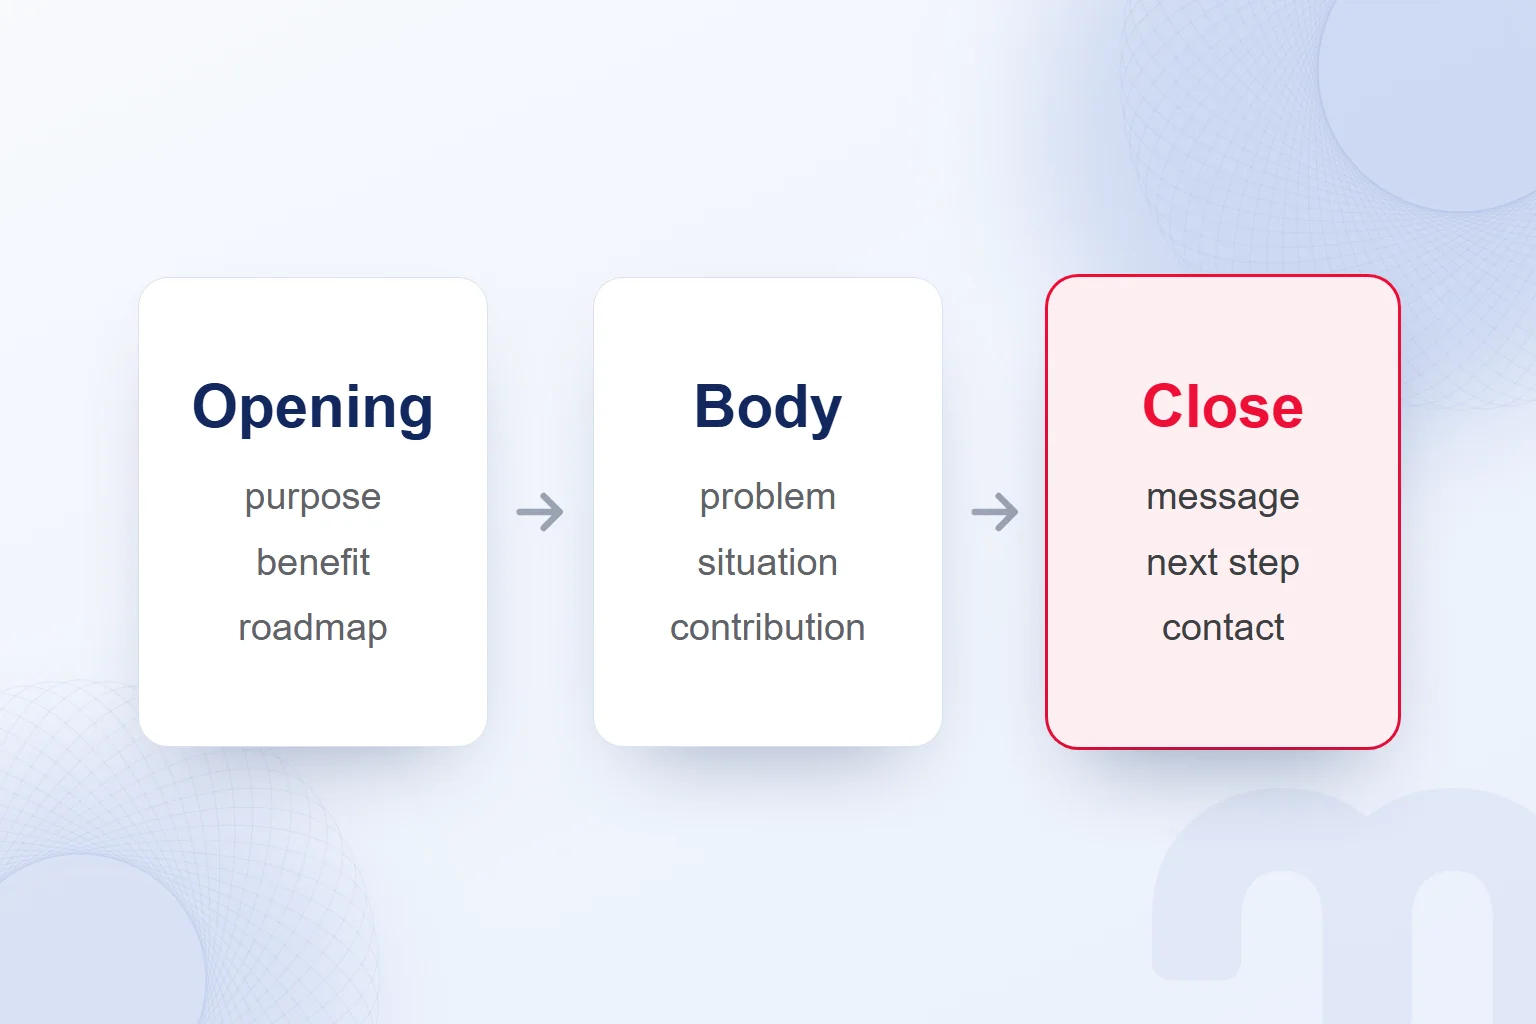
A presentation has an opening, a body and a close; the opening explains the purpose, the body describes the problem and our contribution, and the close states the key message and the expected step. All three are tied to the same key message.
The opening says why we present, what the audience gains, why it matters and in which order we proceed. The body describes the problem, the current situation and the target; we connect the assessment made with a SWOT analysis to the key message, then show our contribution.
A project presentation first defines the problem and why it matters, covers earlier work and what we add, then moves to method, results and future work, ending with a short summary; each section visibly links to the previous one.
The close repeats the key messages and shares announcements, the expected step and the speaker’s contact details. As TUBITAK recommends, questions come at the end, and we state which idea the audience should remember and what they should do.
How do you start a presentation?
We start a presentation by stating the purpose and what the audience will gain, then briefly outline the order of the talk. TUBITAK’s opening trio of purpose, benefit and roadmap goes into our first speaker note, so the audience sees how the topic relates to them and where it is heading.
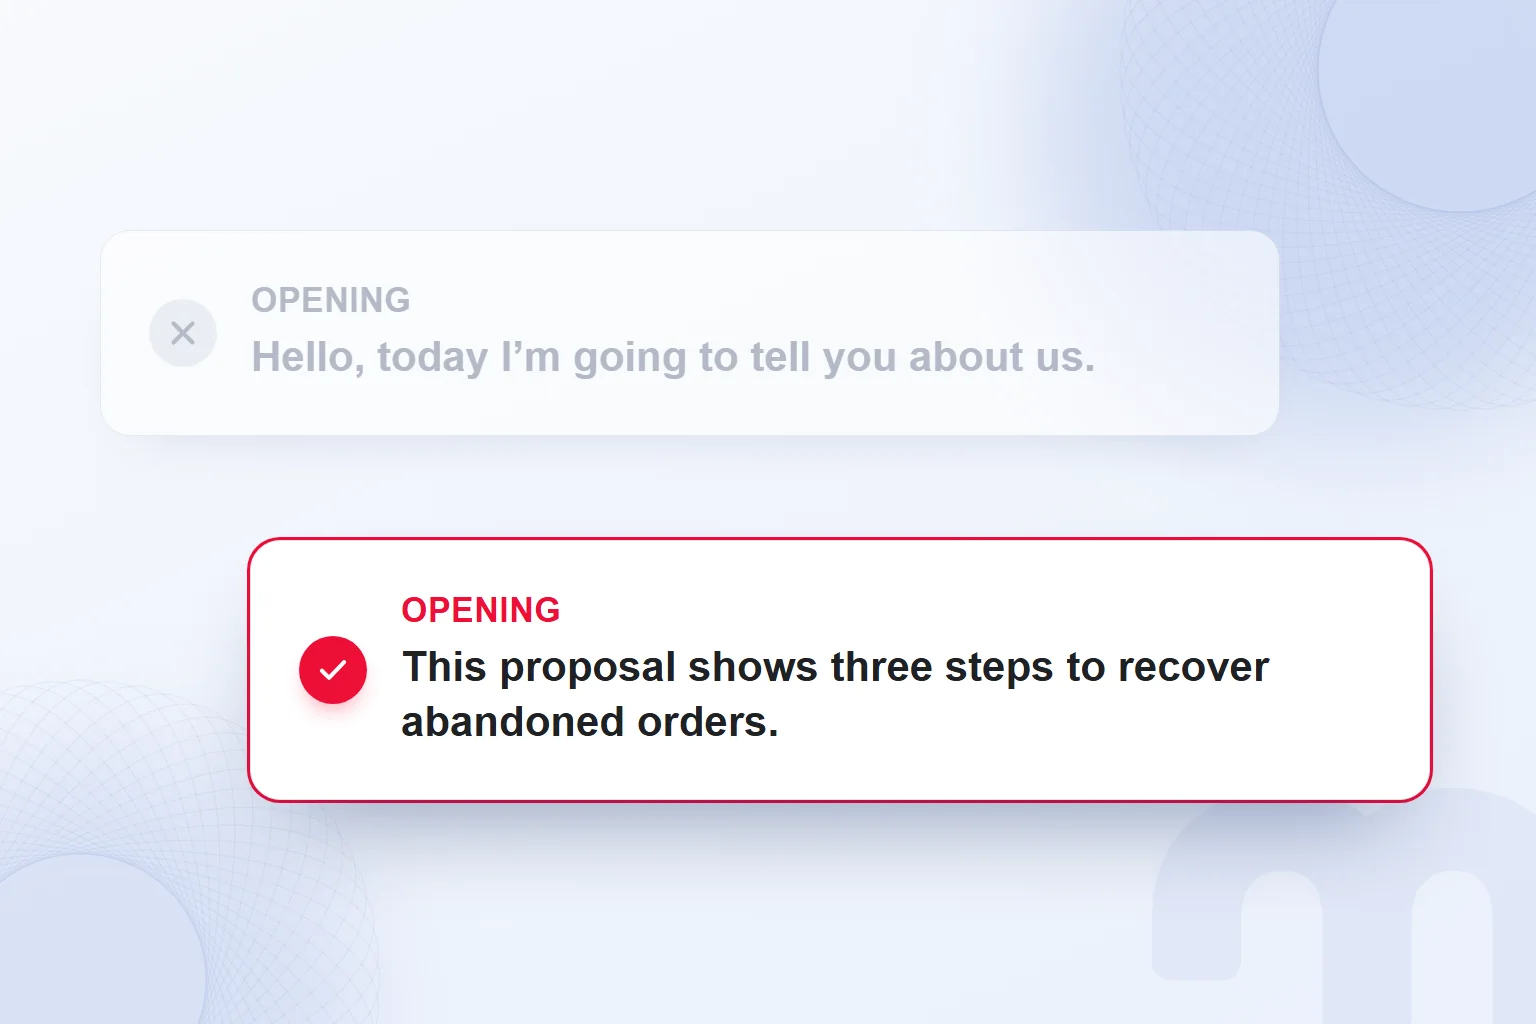
A sample opening line for a proposal presentation: “This proposal shows three steps to recover abandoned orders.” The flow can follow: “First we will look at the current situation, then at the work we propose, and finally at the step we will agree on together.” This shows how to build an opening; it is not a real client result or a promise of success.
The self-introduction stays short, just enough to make our contribution clear. A marketing review opens with the result and the decision it supports; a project presentation opens with the problem and why it matters.
Rehearsing the opening tests more than smooth delivery: is the benefit concrete, are the terms clear, does the body cover what the opening promised? We shorten and rebuild accordingly, and check that the first sentence links to the step asked for on the last slide.
How do you build a proposal presentation?
We open a proposal presentation by summarising the client’s situation and goal, show the problem with data, then cover approach, scope, timeline, success measure and next step, in that order. The proposed work answers the opening problem.
- We summarise the situation and goalWe describe the client’s situation and target and the need the presentation answers.
- We show the problem with dataExisting data makes the problem visible and shows the finding our proposal rests on.
- We explain our approachWe describe how we tackle the problem and serve the goal.
- We define scope and timelineWe present the tasks, schedule and scope clearly.
- We say how success will be measuredWe name the measures for the result, alongside the goal.
- We recommend the next stepAt the end, we state the decision we expect or the work we propose to do.
On slides, each step answers its own question: where we start, what the problem is, what we propose, which tasks we take on, how we assess the result and which decision is needed now. Scope matches the approach and the success measure connects to the opening goal, so the proposal never becomes disconnected service lists.
Timeline and scope hold only verified information; an unsettled task is never a firm commitment. At the close, besides “Any questions?”, we state the step we expect; it follows from the purpose, so not every proposal shares one closing line.
References and a case study use only permitted, provable results, tied to the work they came from and to the problem and approach, reminding the audience of the path from situation to problem to proposal.
TUBITAK’s recommended template presentation and checklist give a structure for last-minute preparation. We adapt the template to our field, check old dates and outdated information at every use, and update the content for the audience and purpose.
Proposal presentation example: an 8-slide flow
An eight-slide proposal draft can be split into purpose, situation, problem, approach, scope, timeline, measurement and decision. The example below is a flow we use to place proposal notes; we fill it with the client’s verified information.
- Purpose and benefit: The opening line names the need the proposal answers and what the audience can assess by the end.
- Current situation: The starting point is summarised with the data’s period and metric; unrelated details are removed.
- Problem addressed: Which finding calls for work is explained, and the evidence behind it is visible on this slide.
- Proposed approach: How the work answers the problem is explained; a short title shows the link between the previous finding and the proposal.
- Scope of work: Tasks are listed with their contribution to the approach; tasks not yet agreed are not presented as firm commitments.
- Work timeline: The plan is shown; leftover template information is cleared and nothing outside the scope is added.
- Success measure: The measures for assessing the result are explained, readable together with the initial goal.
- Expected step: The decision asked for and contact details are shared; the key message is repeated, then questions follow.
We reassess the slide count in rehearsal, splitting pages that hold more than one key message. The titles read in order should show the proposal’s reasoning; the template is never a mould for the same amount of text.
Which AI tool makes presentations?
There is no single “best” AI tool for making presentations; the choice depends on the program and plan you use. We decide where the deck will be built and whether we need a content draft or slide creation, then check the features and limits on our account.
The tools do not do the same job under the same conditions: a PowerPoint feature, Google Slides access and free AI credits are separate situations. We weigh the account required, the way of working and the editing needed afterwards.
| Tool | Where it works | What to know |
|---|---|---|
| Copilot in PowerPoint | In PowerPoint’s chat pane | Creates a presentation from a prompt or a file you have access to; Microsoft 365 subscription and organisation settings affect access. |
| Gemini in Google Slides | In Google Slides | Needs an eligible Google Workspace or Google AI plan; full presentation creation is desktop-only and English-only. |
| Gamma | In Gamma | On the free plan every AI action uses credits; free credits do not renew. |
| ChatGPT | Drafting in ChatGPT; the PowerPoint add-in | The PowerPoint add-in is limited on the Free plan. |
| Claude | In Claude | Slides and Docs outputs are available on the free plan. |
Plan information is a condition for the feature we need: using Google Slides with a Google Account does not mean Gemini can create a whole deck on that account. We confirm the feature on the working account first.
How do you make a presentation with Copilot in PowerPoint?
To make a presentation with Copilot in PowerPoint, we open a new presentation, type a prompt into the Copilot chat, develop the outline and create the slides. The flow Microsoft Support describes includes continuing to edit through conversation after the first request.
- A new presentation is openedWe start with a new presentation in PowerPoint.
- Copilot is selectedWe select the Copilot icon at the bottom right and move to the chat pane.
- A prompt is writtenWe describe the deck, adding the key message, audience and time available.
- Questions are answeredWe answer any questions Copilot asks about audience, style and similar topics.
- The outline is developedWe review topic order and content in the chat, then create the slides.
- The slides are editedWe edit the deck through the chat and finish the content and format checks.
Creating a presentation from a file requires access and permission. Microsoft notes that Word documents using styles and files under 24 MB give better results; we check the document against these limits and review its accuracy before generating slides.
If the Copilot icon does not appear, the feature may be missing from the Microsoft 365 subscription or turned off by an organisation setting, so we check both. The key message and section order do not need automatic slide generation, so that work continues.
How do you make a presentation with ChatGPT?
When making a presentation with ChatGPT, we give the key message, audience and time first and treat the output as an outline to edit. The prompt states the purpose, notes, section order and one message per slide; general use is covered in our What is ChatGPT article.
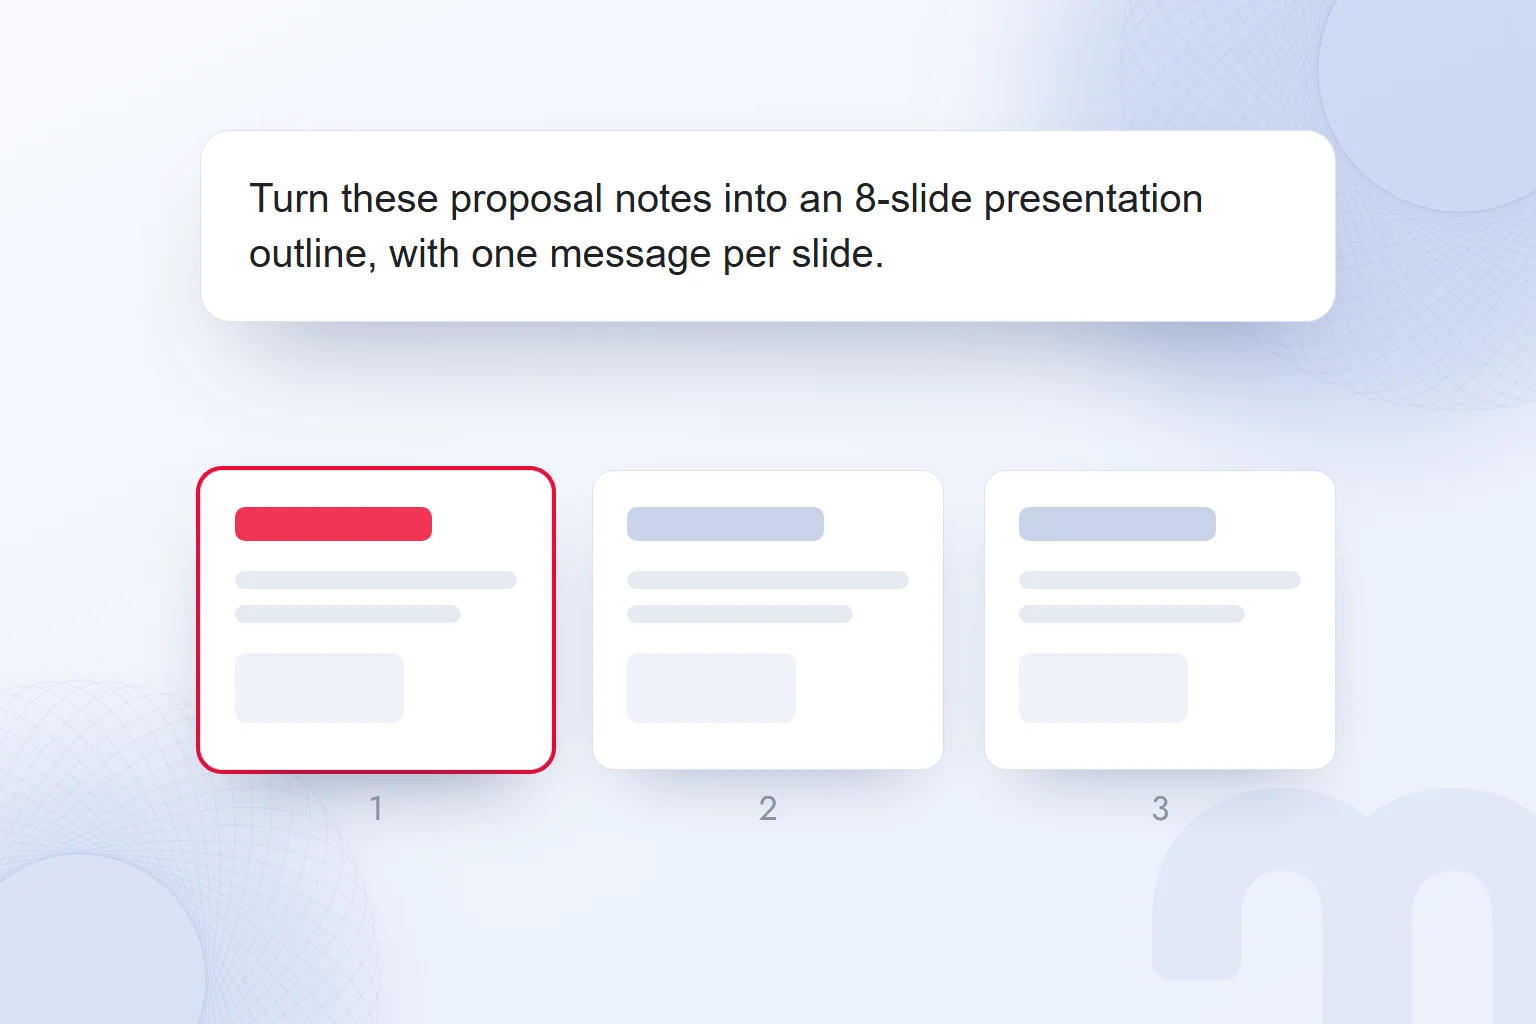
A sample prompt, to be filled with our own information: “Our key message: [one-sentence message]. Audience: [people attending]. Time available: [talk length]. Turn these proposal notes into an 8-slide presentation outline, with one message per slide. In the opening, explain the purpose and what the audience gains. In the body, cover the situation, problem, approach, scope and success measure in order. At the end, state the expected step. Use only the data in my notes; flag missing information as a question. For each slide, suggest a title, short content and a speaker note.”
Eight slides is the scope of this sample, not a rule; we re-split by time and topic. The tool is not expected to guess empty fields: a missing goal, unclear scope or unsourced result stays an open question.
We read the first output from the titles: do topics follow on, do two slides overlap, does the conclusion return to the purpose? Then we assess short texts and speaker notes separately. We also allow for the limited PowerPoint add-in on ChatGPT Free, keeping drafting separate from the add-in’s terms.
Free presentation software
Google Slides can be used with a Google Account; Gamma offers free AI credits, and Claude’s free plan includes Slides and Docs outputs. We check the right to use a program separately from its AI feature’s conditions; free access does not mean unlimited creation.
According to the Gamma Help Center, every AI action on the free plan uses credits that do not renew; when they run out, you earn credits through referrals or move to a paid plan, where credits renew monthly. We plan around this limit.
In Google Slides, Gemini uses “Help me create a slide” for a single slide and the “Presentation” option on the start screen for a whole deck. The eligible plans Google lists are Workspace Business Standard and Plus, Enterprise Standard and Plus, and Google AI Pro and Ultra. Full presentation creation is desktop-only and English-only, so for a deck in another language, such as Turkish, we do not assume this feature can build it directly. We weigh this together with our What is Gemini article.
Claude’s free-plan Slides and Docs outputs are another option. Whatever the tool, we review terms, abbreviations and sentences for the audience and never accept a generated title just because it looks tidy.
Considering the working environment and expected output together, the choice splits into these paths:
- The team uses Microsoft 365 → we check whether Copilot in PowerPoint is enabled in the subscription and organisation settings; with access, we develop the outline through the chat.
- The team uses Google Workspace → we check the eligible plan for Gemini and, for a deck in another language, account for the desktop-only and English-only condition of full presentation creation.
- Only a draft is needed → we ask for a content draft with the key message, audience, time and verified notes, and review the flow before moving it onto slides.
How do you check a presentation made with AI?
We check a presentation made with AI for its key message, source accuracy, slide format and narrative flow, returning to the audience, purpose and time in the preparation note. Beyond typos, we examine the basis of every claim and the role of every slide.
Each number, rate or result is matched with the source: are period, unit and metrics the same; is the statement a current situation, a target or a proposal? A desired result that became an achieved success on a slide is corrected, and an unsupported claim is never presented as proven.
A chart’s title is checked with its numbers; a chart that shows only a comparison claims no cause or definitive result. Reference and case slides use permitted, provable results, and a finding with an incomplete source is completed before any eye-catching chart is built.
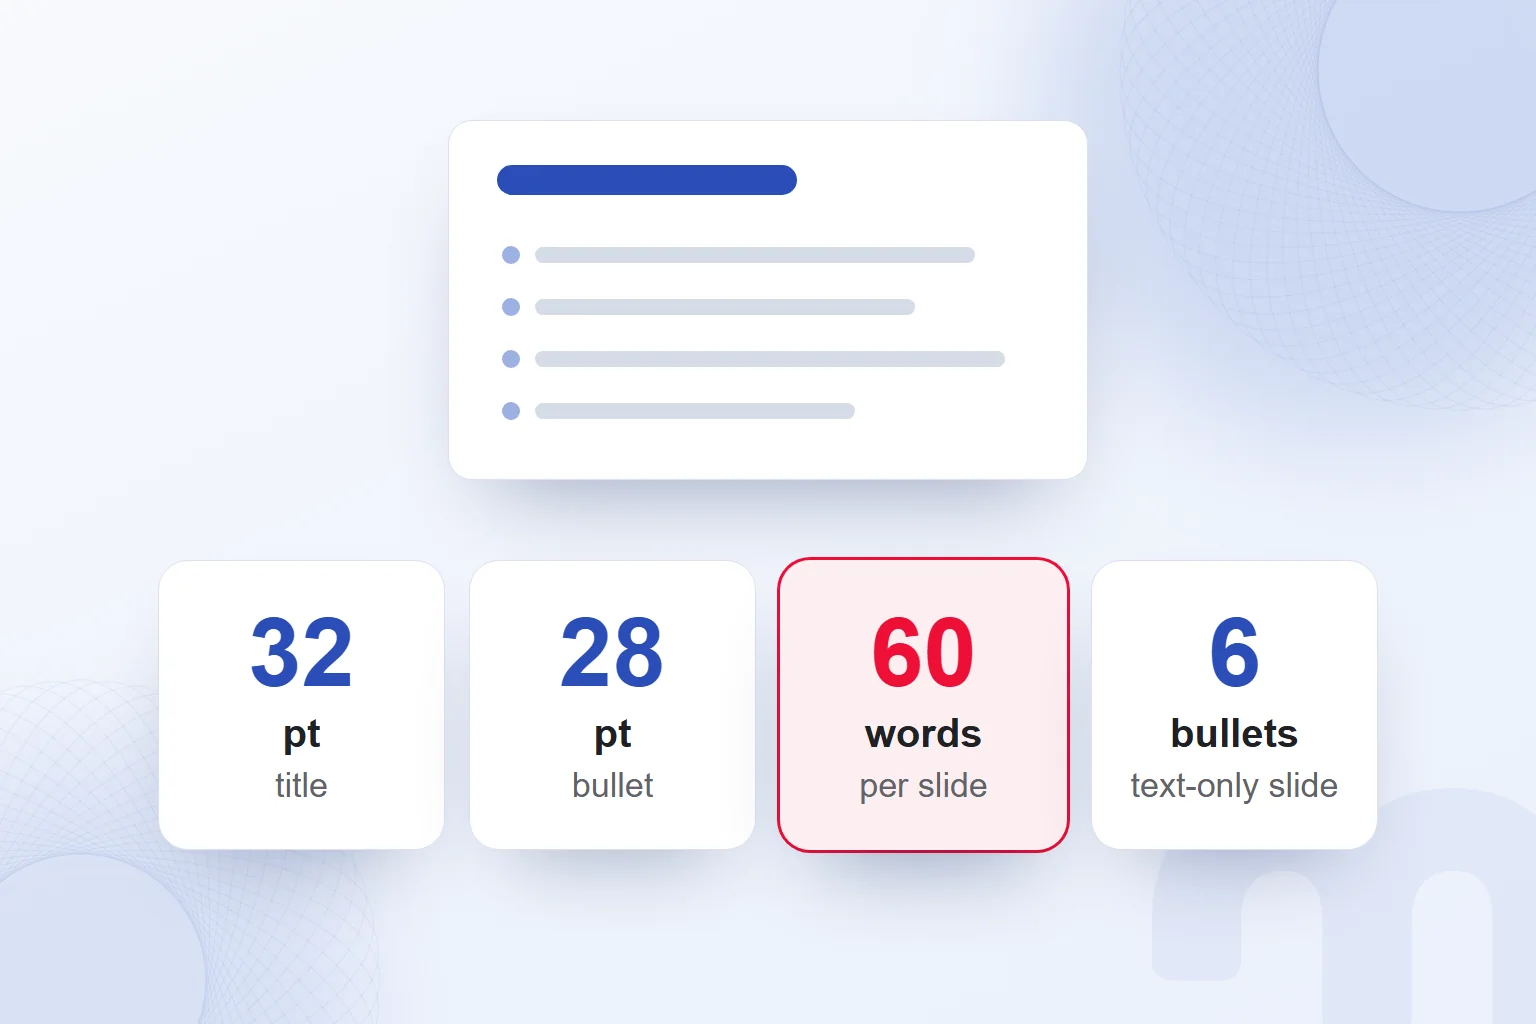
We run the format check against TUBITAK’s limits for presentations given on behalf of the institution: titles at most 32 pt, first-level bullets 28, second-level 24, third-level 20 pt; at most 60 words per slide and 6 bullets on a slide without visuals. These limits are not targets to fill; if less text tells the message, we keep the white space.
Next, titles stay on one line, bullets within two lines, and a slide preferably uses no more than two text sizes. We check readability against Microsoft’s recommendation of at least 18 pt. Instead of shrinking text to fit a box, we shorten the sentence while keeping the key message, or split the content.
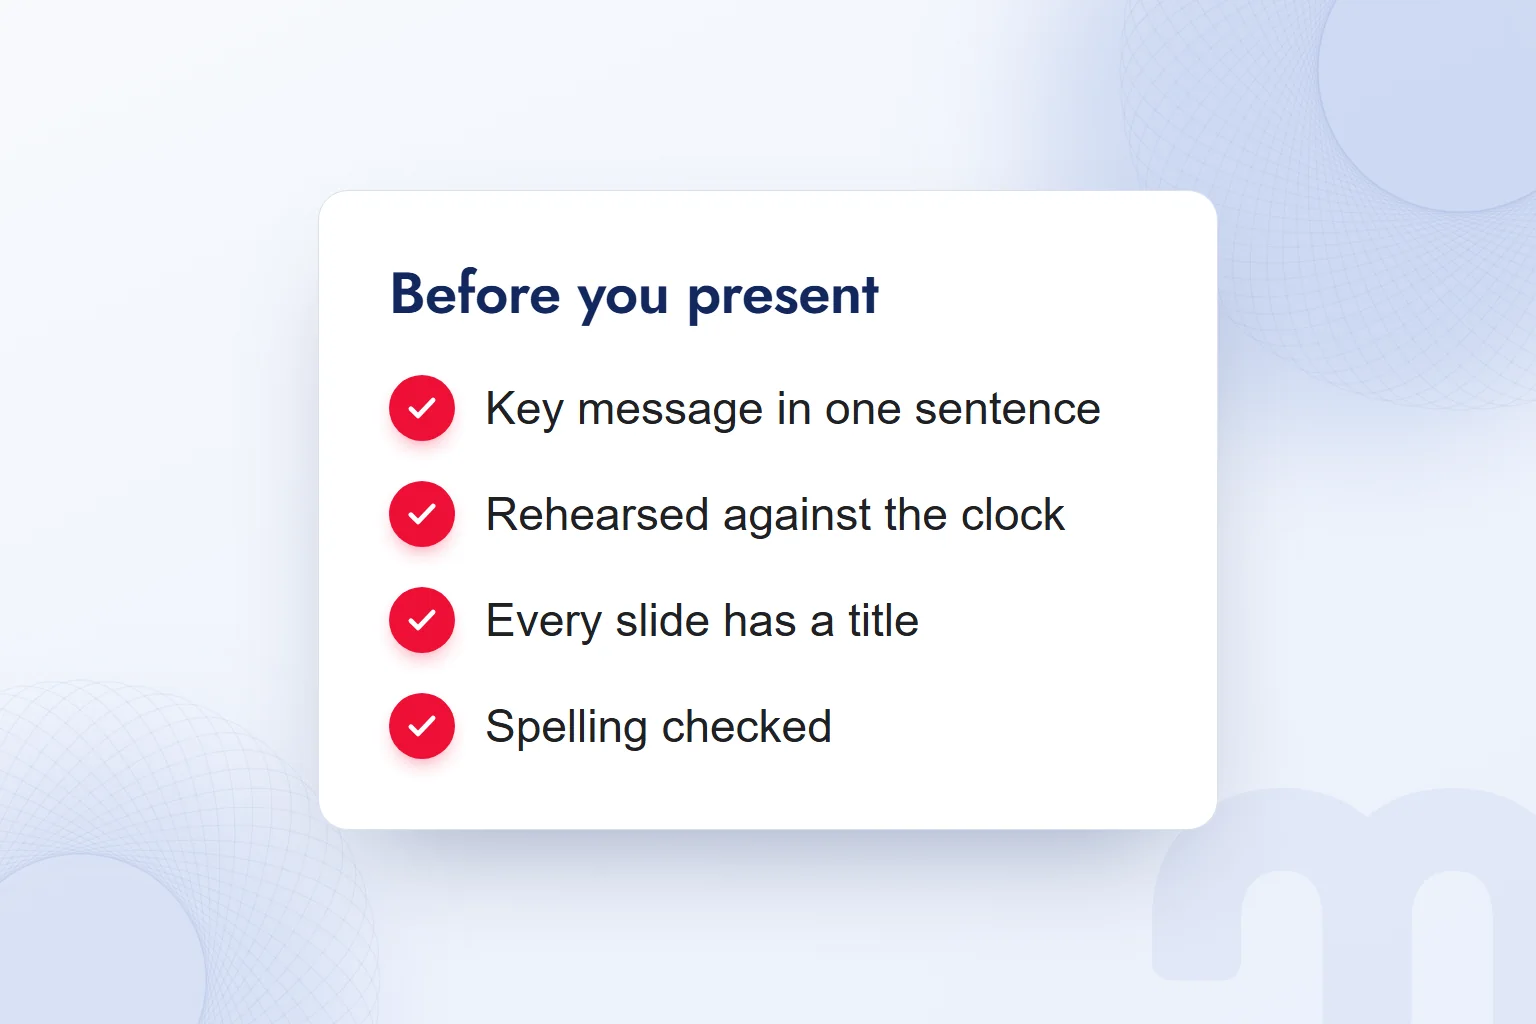
The final read marks technical terms and unexplained abbreviations, applying TUBITAK’s 90%/99% clarity standard to AI output too. If the opening’s promise does not match the closing step, we rebuild the flow. The file is ready after a timed rehearsal and a check on the presenting computer.
How do you show data in a marketing presentation?
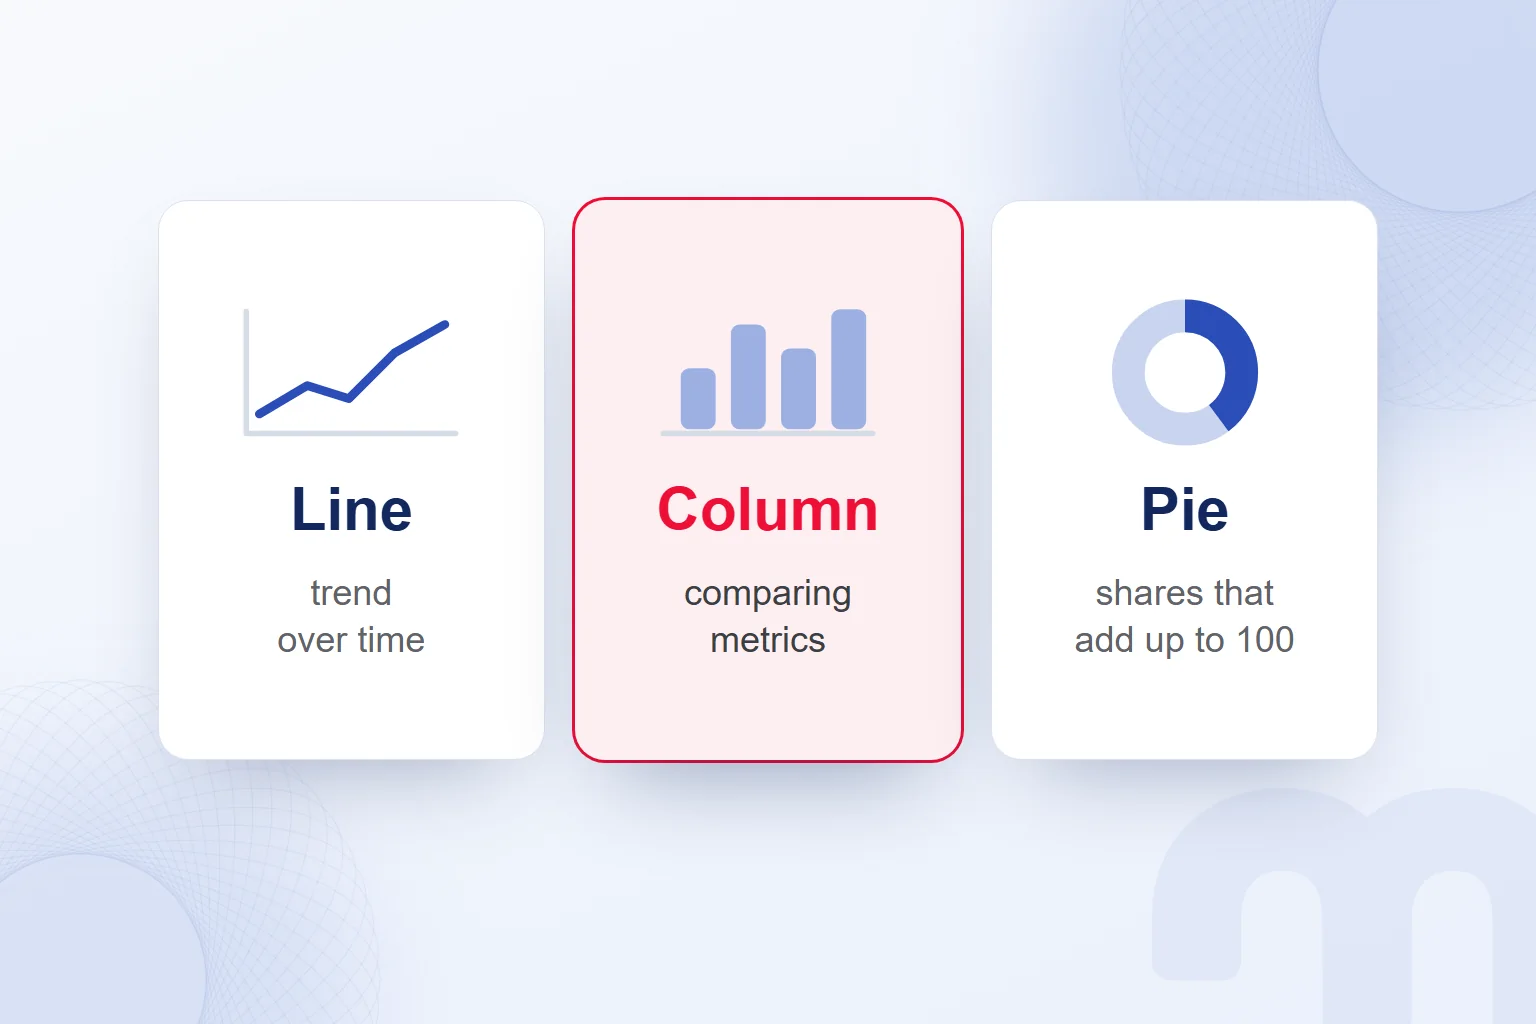
In a marketing presentation, we show data with a chart that fits the change or comparison we want to explain, and each slide title states one message. Using TUBITAK’s chart selection criteria, we choose the format by what the data says.
| Display | Best at showing | Watch out for |
|---|---|---|
| Line chart | A trend that changes over time | The time range is written on the chart |
| Column chart | Comparing metrics at a given moment | Data is of the same kind |
| Pie chart | A proportional breakdown that adds up to 100 | Only for data whose parts make up the whole |
| Table | Data with very different magnitudes | Colour for emphasis, not decoration |
For a chart to stand on its own, it shows what the axes mean, the unit, the time range and, for money, the currency. Compared data is of the same kind, with matching periods and currencies. When rounding, we write about 16 thousand instead of 15,982.
A title that only names the topic, such as “Marketing results”, is not enough; a short sentence states the change the chart confirms, and compared periods are defined. A table that does not support the key message is left out, so the number and the conclusion meet in one place.
We do not animate slides with charts; the chart appears as a whole. We use dark text on a single light background and make the chart large and sharp enough to read from the back row. In tables, colour marks the information to be emphasised.
We build the reports that bring marketing data into presentations in our Looker Studio reporting service, matching each chart with its message and showing the supporting information on the same slide.
How do you design a slide?
We design a slide with short text that supports one message, a relevant visual and a readable layout. TUBITAK’s rules for presentations given on behalf of the institution set the upper limits below; we use them as design yardsticks.
Bullet text is at most 28 pt at the first level, 24 pt at the second and 20 pt at the third. We never put all these levels on one slide and preferably use no more than two text sizes per slide.
Titles stay on one line, preferably within 5 words. Bullets stay within two lines, text is left-aligned and text boxes are kept away from the edges. We avoid all caps in titles and content. Word and bullet limits are not targets; we write just enough to convey the message.
A visual is chosen for its link to the message; empty space is never filled with decoration, so white space brings the content forward. Slides share one typeface and similar colours and sizes, and transitions keep the current section and key message visible.
How do you make a presentation accessible to everyone?
We make a presentation accessible with unique slide titles, alternative text for visuals, readable type, sufficient contrast and the correct reading order. We apply the recommendations in Microsoft’s PowerPoint accessibility guide to every element.
Every slide gets a unique title, which people with visual or reading difficulties follow as they navigate. Every visual gets conveying its key points. Colour never carries information alone, and text and background have sufficient contrast.
We weigh Microsoft’s 18 pt minimum together with TUBITAK’s upper limit for titles and keep text between 18 and 32 pt, within the limits of each title and bullet level. We use a sans-serif typeface and enough spacing, and avoid many italic or underlined words.
A screen reader reads elements in the order they were added to the slide; when that differs from the visible layout, we adjust the reading order. Tables keep a simple structure with column headers, without split or merged cells or nested tables. Link text states where it leads, and videos get captions.
What are common presentation mistakes?
Common presentation mistakes are reading from the screen, running over time, leaving outdated information and overfilling slides. We check text, flow and conditions together during preparation.
The path splits according to the situation:
- We are reading the slide off the screen → we do not copy what we will say onto the slide, and we make eye contact with the audience.
- Time is running short → we rehearse against the time available.
- Outdated information is left in the template → we update dates and expired information before presenting.
TUBITAK also lists blocking the screen, turning your back on the audience, going off topic and showing an information-heavy slide for under 10 seconds. We keep the screen clear and give time to study each slide.
We rehearse often, ideally recording the talk and watching it with people we trust, but not in front of a mirror. We test room, lighting and sound, check the file and its videos on another computer, and run the spell checker.
We prepare for questions and listen to understand, without getting defensive; an unknown answer is admitted politely and sent later. More guides on presentations and marketing data are in our digital marketing articles.
Frequently asked questions
What does presentation mean?
A presentation is the act of presenting, and the delivery of a message to an audience through various means.
What is the difference between a slide and a presentation?
A slide is each image projected during a presentation; the presentation is the whole act of delivering information to an audience. Slides support the key message.
How many words should a slide have?
The upper limit TUBITAK sets for presentations given on behalf of the institution is 60 words. We keep slide text short enough to support the key message.
What font size should a presentation use?
Microsoft recommends at least 18 pt; for TUBITAK’s institutional presentations, the upper limit for titles is 32 pt. We use both together.
How do you start a presentation?
With the purpose, the audience’s benefit and the flow of the talk. A sample opening: “This proposal shows three steps to recover abandoned orders.”
How do you end a presentation?
We repeat the key messages and share the step we expect and our contact details. We take questions at the end.
Is there a free AI that makes presentations?
Yes: Claude’s free plan includes Slides outputs; Gamma’s free AI credits do not renew, and the PowerPoint add-in is limited on ChatGPT Free. Google Slides works with a Google Account; Gemini features need an eligible plan.
How do you check a presentation made with AI?
We verify data and claims against the source and check that each slide carries one message. After applying TUBITAK’s format limits and Microsoft’s accessibility recommendations, we rehearse against the clock.

 How to make money on Instagram: eligibility requirements and toolsRead article
 What is a slogan? How to write one, and how it differs from a taglineRead article
 What is Pantone? Color palettes, color codes and brand colorsRead article
 What is a SWOT analysis? How to do one, and how it differs from PESTRead article
 What is a case study? How to write a client case study, with templateRead article
 What is a blog, and what is a blogger? How to write a blog postRead article
 Instagram post size: square, portrait, story and Reels dimensionsRead articleMost read
 What is a hashtag? How to use hashtags and how many to addRead article
Questions & answers
0 commentsNo questions yet; you can ask the first one.