





 Cihat Murat Yüksel
7 min read
Cihat Murat Yüksel
7 min read
What is ROAS? Formula, ROAS vs ROI and how to set target ROAS
ROAS is the ratio of advertising revenue to ad spend. It shows how much revenue each dollar spent on ads brings in, and it is read alongside margins, not as profit.Pro
Contents 9 sections
ROAS is the ratio of advertising revenue to ad spend; calculated as revenue ÷ ad spend, it shows how much revenue each dollar spent on ads brings in. We read the revenue here as and check which sales it includes.
ROAS stands for return on ad spend, the term Google Ads uses in its help documentation. We read this ratio together with the product’s contribution margin: the same revenue and spend leave different profit when product costs differ. To set a target, we calculate costs first, then the revenue ads need to cover.
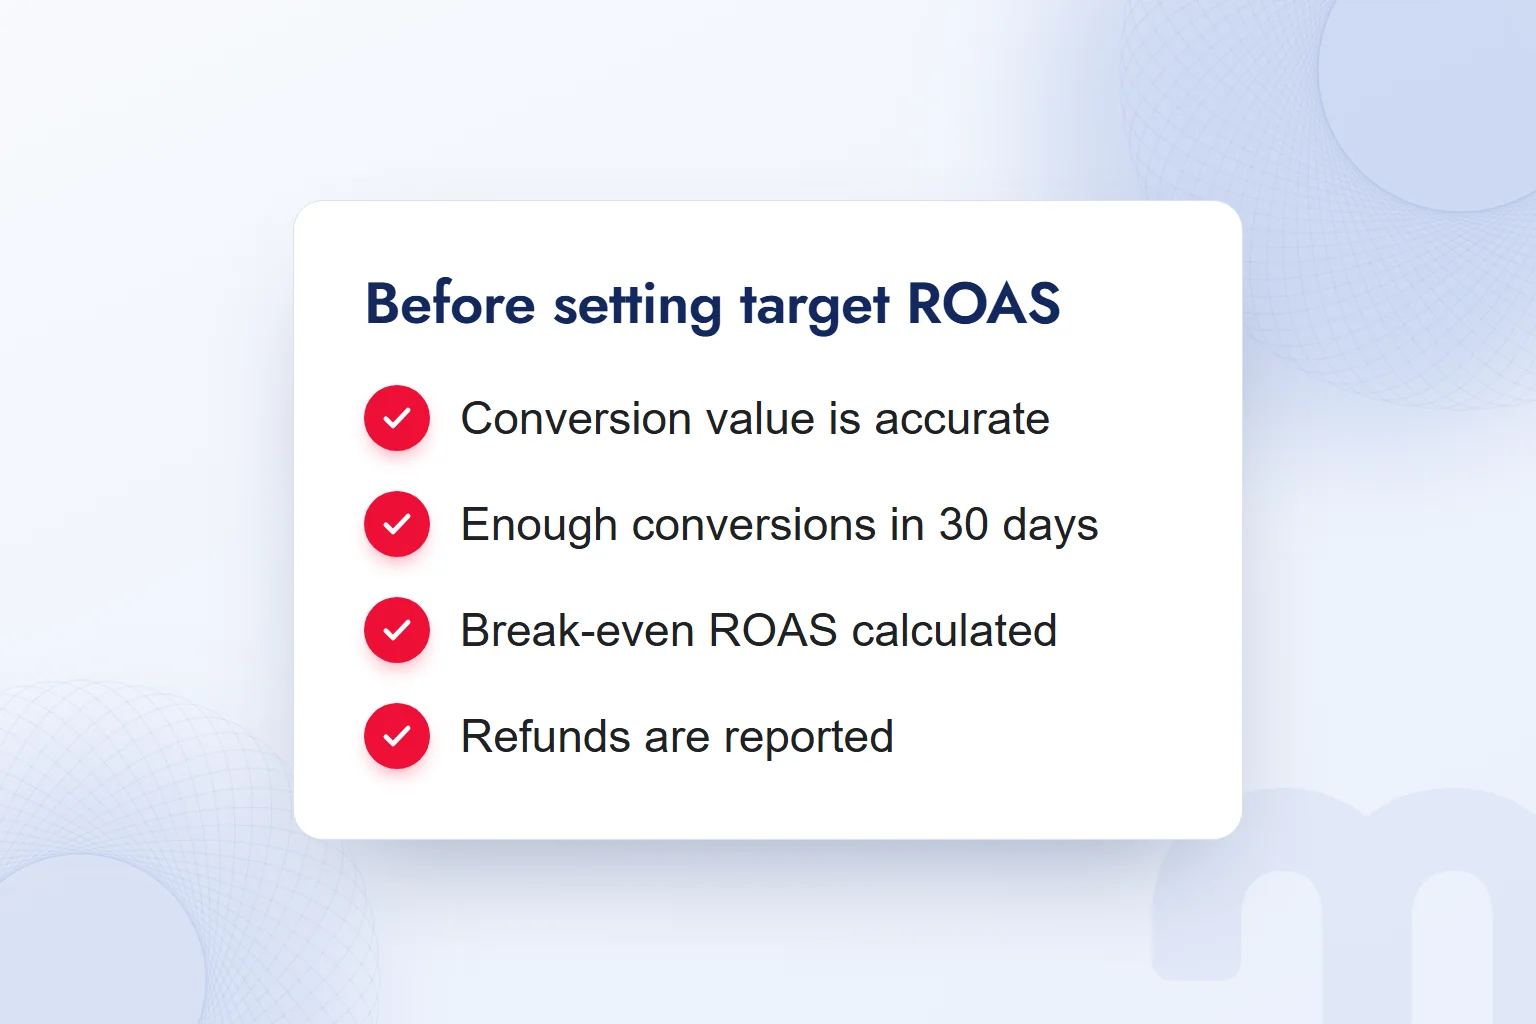
ROAS is assessed against the break-even threshold, and conversion value is compared with order data before a target is set.
What is ROAS?
ROAS is a ratio that measures the revenue generated in return for ad spend. It shows the revenue from advertising, not what product costs, shipping or payment fees amounted to, so we do not call it profit.
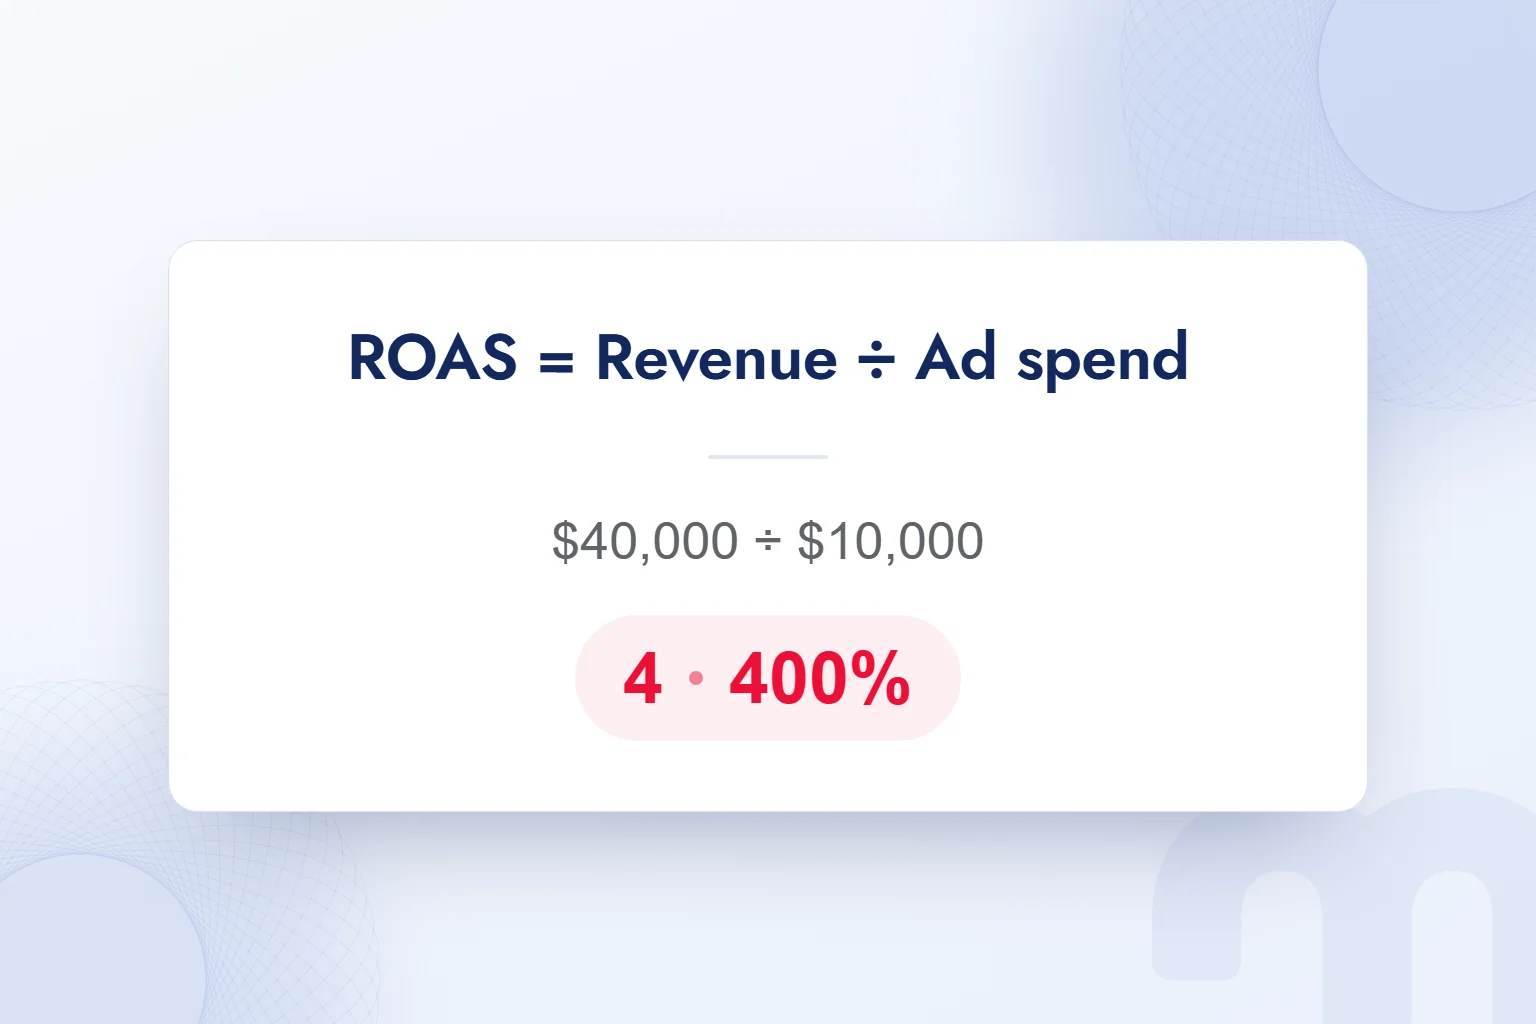
A ROAS of 4 means every $1 spent on ads generated $4 in revenue, also written as 400%. Both describe the same calculation; the percentage sign does not mean revenue or profit grew. Our reports state which form we use.
How do you calculate ROAS?
We calculate ROAS by dividing advertising revenue by ad spend. The formula is ROAS = revenue ÷ ad spend. First, we establish which campaign and period the revenue belongs to and set it against spend with the same scope.
Suppose $10,000 in ad spend generates $40,000 in revenue: $40,000 ÷ $10,000 = 4. Multiplied by 100, that is 400%. The $40,000 enters the calculation before any costs are deducted.
We record the revenue and spend behind each result, so when the ratio changes we can see which amount moved. If revenue holds while spend falls, ROAS rises; we do not report that as sales growth. In campaign decisions, we read revenue size and the ratio together.
What is the difference between ROAS and ROI?
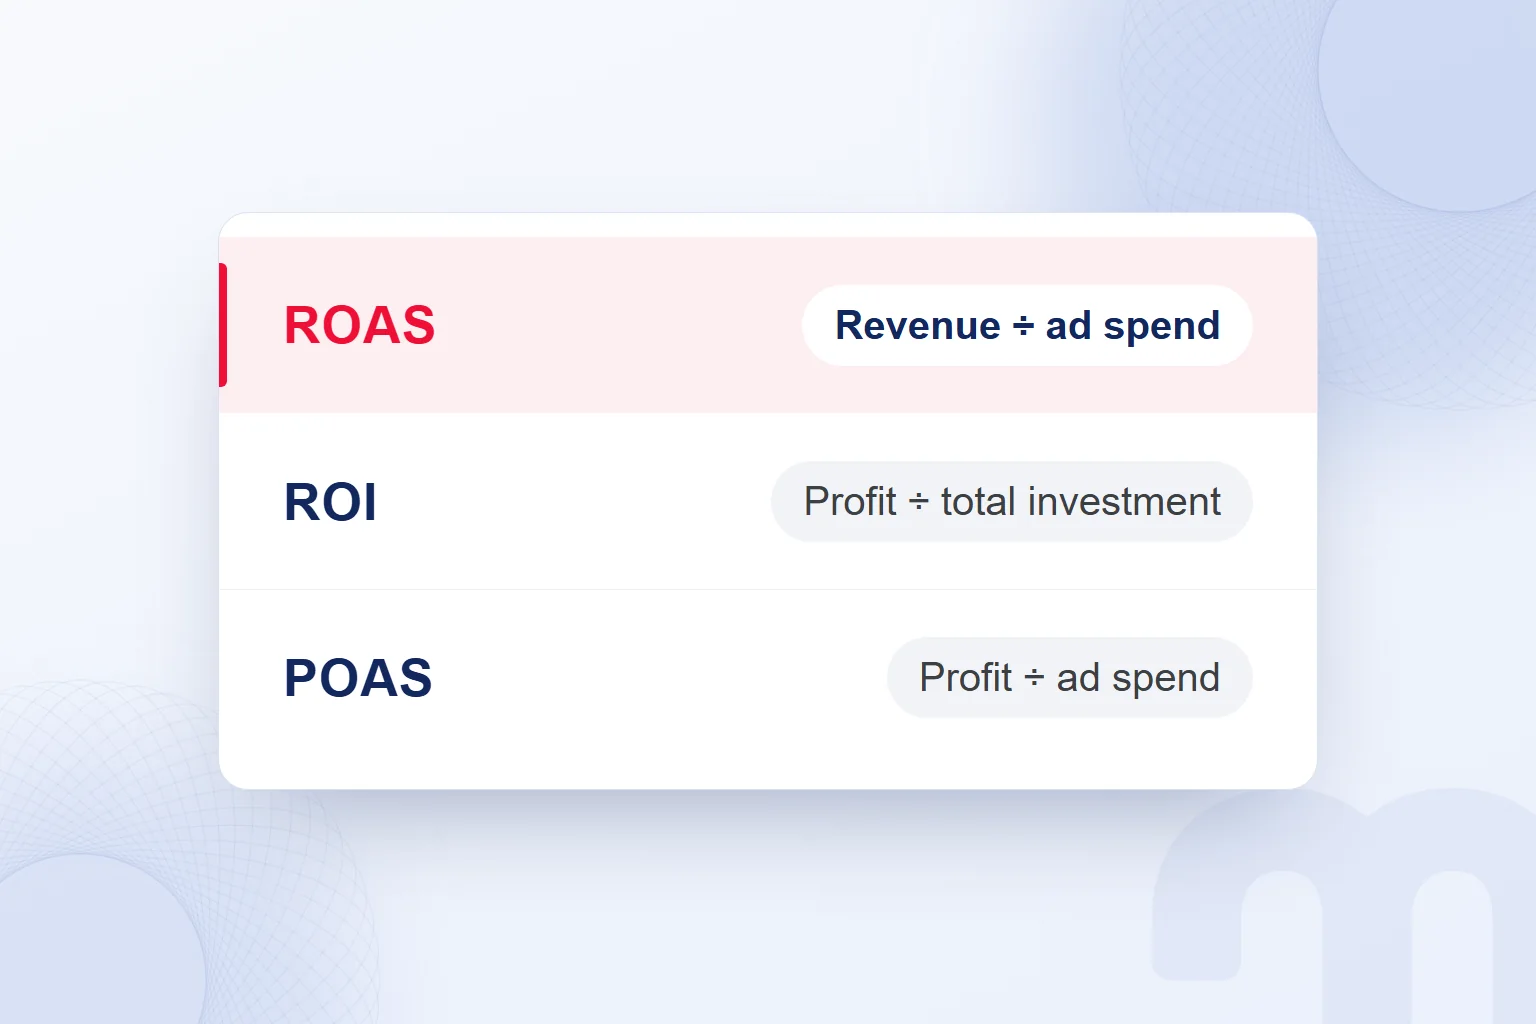
ROAS divides revenue by ad spend, whereas divides profit by total investment. The formula ROI = (revenue − total cost) ÷ total cost takes every cost into account. ROAS evaluates the revenue ads bring in; ROI evaluates what remains after costs.
Suppose $40,000 in revenue comes with a total cost of $35,000, including ad spend. Profit is $5,000, and ROI is 5,000 ÷ 35,000 = about 0.143, or 14.3%. With $10,000 of that as ad spend, ROAS is still 4. A ROAS of 400% does not mean the investment returned a 400% profit.
POAS divides gross profit from advertising by ad spend, bringing product margins into the result. MER divides total revenue by total marketing spend and shows efficiency across channels. When comparing them, we check whether the numerator is revenue or profit and which costs enter the denominator.
How do you find break-even ROAS?
We find break-even ROAS by dividing 1 by the contribution margin, using the margin as a decimal. Contribution margin is what remains of the selling price after product cost, shipping, payment fees and a returns allowance, divided by the price. This sets the share available to cover ad spend.
If $600 in counted costs comes off a $1,000 selling price, $400 remains. The contribution margin is 400 ÷ 1,000 = 40%. Break-even ROAS is 1 ÷ 0.40 = 2.50, or 250% as a percentage.
| Contribution margin | Break-even ROAS | As a percentage |
|---|---|---|
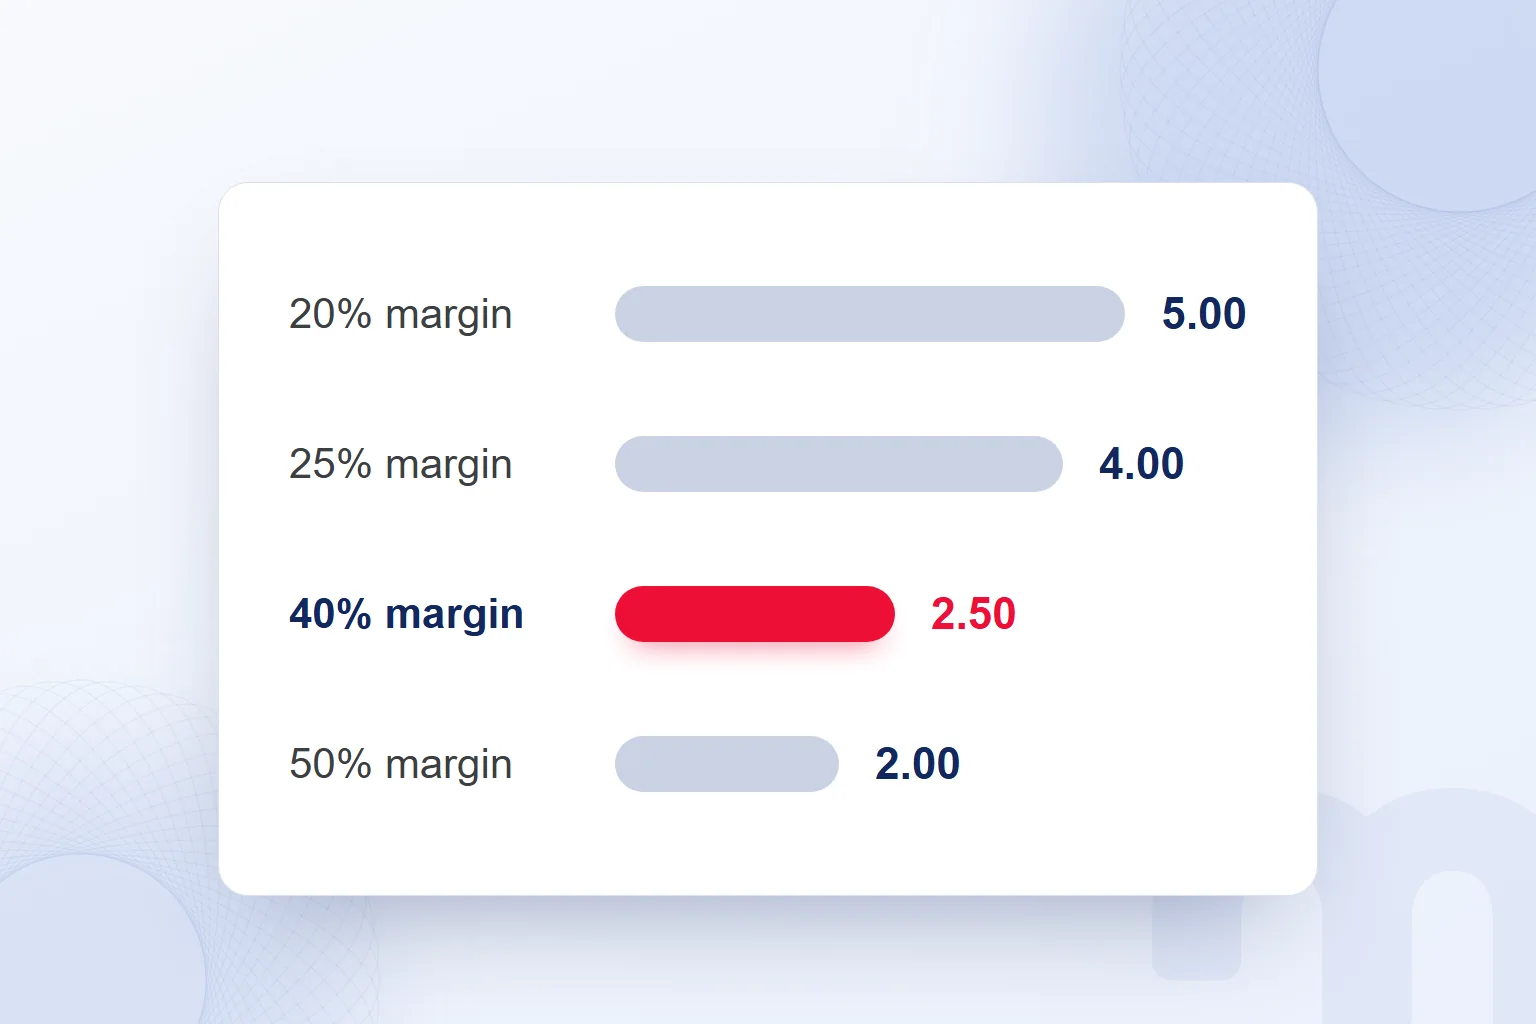
| 20% | 5.00 | 500% |
| 25% | 4.00 | 400% |
| 30% | 3.33 | 333% |
| 40% | 2.50 | 250% |
| 50% | 2.00 | 200% |
| 60% | 1.67 | 167% |
A lower margin means ads must bring in more revenue to cover the same spend. At a ROAS of 4, a 40% margin product clears its threshold, while a 20% margin product needs 5. So we do not give everyone the same “good ROAS” number. Above the threshold, the target also leaves room for profit.
We update this threshold as costs and prices change. If shipping or payment fees rise while the price holds, the margin falls and break-even ROAS rises. Before keeping a target based on earlier costs, we recalculate the margin to see whether the same ROAS still covers ad spend.
How do you set a target ROAS?
We set target ROAS above the break-even threshold, as a ratio of revenue to spend that covers the profit margin we want. In Google Ads, target ROAS is a bid strategy that sets bids from the predicted value of conversions, entered as a percentage.
Google’s 500% example shows how a target is written; we calculate ours from our costs. With a 40% contribution margin and 10% of revenue kept as profit after advertising, 30% is left for ads. The target is 1 ÷ 0.30 = about 3.33, or 333%. Here the profit share comes out of revenue rather than being added to the break-even ratio.
- We calculate the contribution marginWe deduct product cost, shipping, payment fees and a returns allowance from the price and divide the remainder by the price.
- We find break-even ROASWe divide 1 by the contribution margin as a decimal to set the threshold that covers ad spend.
- We set aside profit and define the targetWe take the profit share out of the margin and calculate target ROAS from the share left for ads.
- We check conversion value and volumeWe confirm what the sales value includes and check the 30-day conversion requirement for Search and Shopping.
- We enter the target and adjust it graduallyWe use the percentage form and track how changes affect traffic and sales volume.
- We compare with order dataWe compare platform results with GA4 and order data, including refunds and cancellations.
Google Ads Help notes that a very high target can limit ad traffic. In our Google Ads consulting, we evaluate the target together with contribution margin and sales volume. The campaign setup sequence is covered step by step in how to advertise on Google. Meta’s bid strategies also include a ROAS goal.
Why does platform ROAS differ from order data?
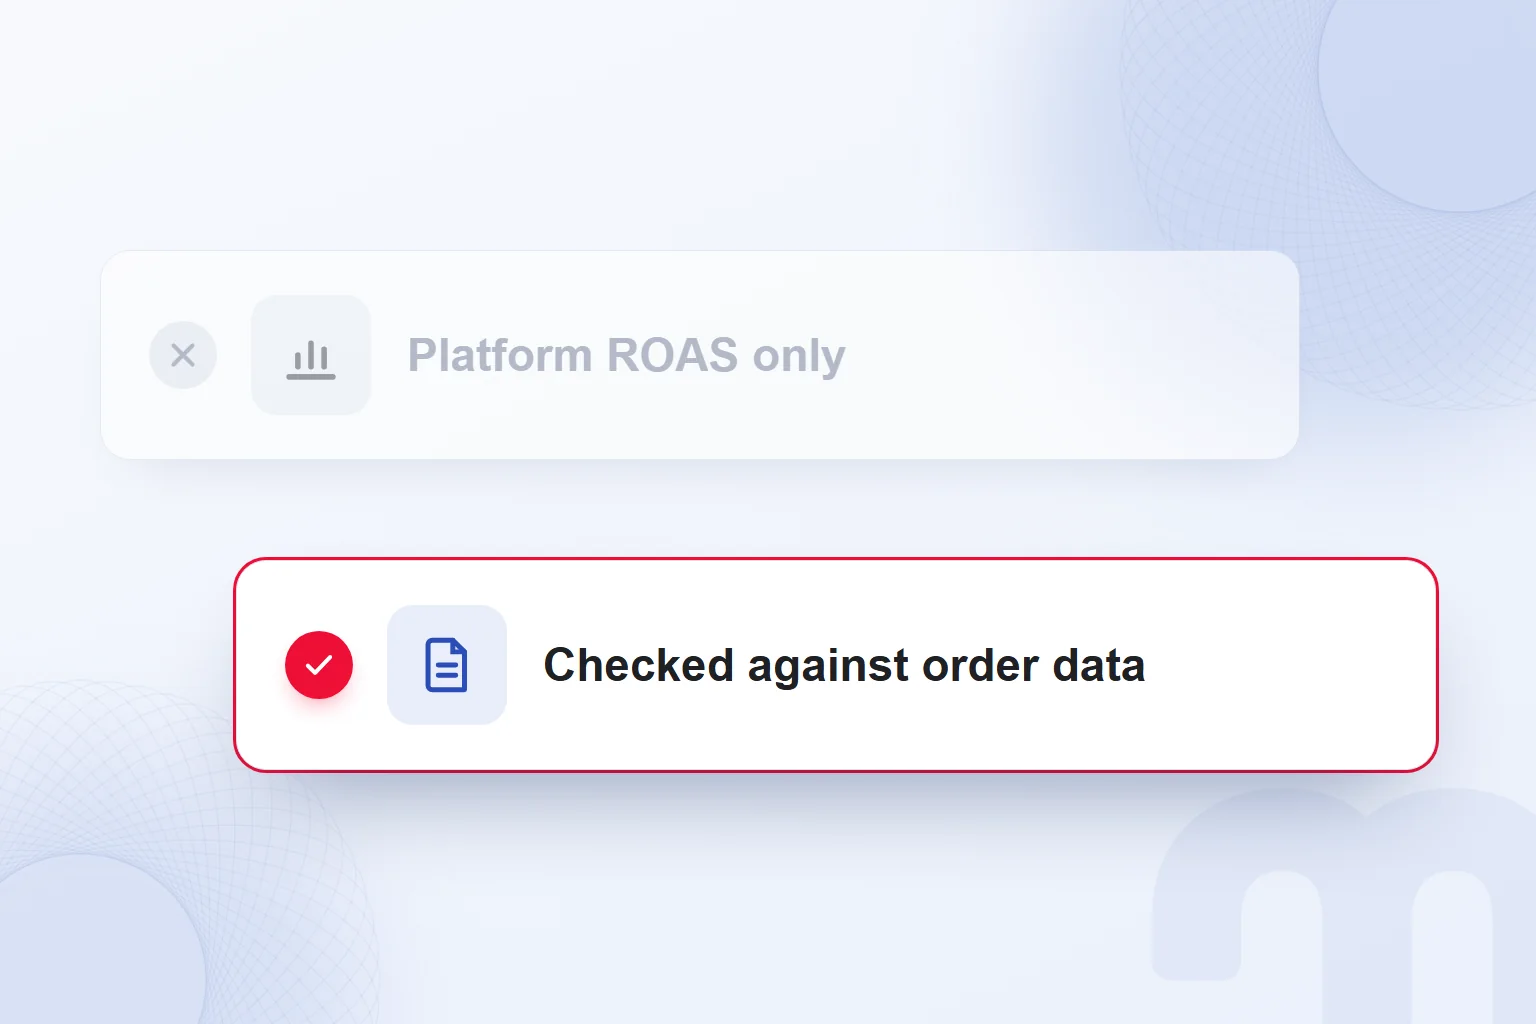
Platform ROAS differs from order data because each platform counts sales by its own and does not deduct refunds or cancellations that are not reported to it. The same order can appear on several platforms, so we do not add up platform-reported revenue as the business’s total sales.
We first align the scope of sales value: one rule decides whether VAT and shipping are included in conversion value, and the report states it. An amount with shipping and one without are not compared as the same revenue.
Next, we check platform results against GA4 and order or accounting data. Refunds and cancellations do not reduce ROAS unless reported to the platform; we check whether they reach the measurement. When we find a gap, we compare the attribution rule and reported sales value before changing the target. We build the reporting setup with the approach in what is a dashboard.
What do we do when ROAS is low or high?
When ROAS is low or high, we first check the break-even threshold, sales volume and the match with order data. The same ratio does not call for the same change in every business; the source of the gap decides.
Three different needs, three different responses:
- ROAS is below the break-even threshold → we split data by product and campaign, review low-margin products separately, and check the landing page and the cart.
- ROAS is high but sales are not growing → we check whether the target limits traffic and lower it gradually to test sales volume.
- High on the platform, low in order data → we compare attribution and refund gaps using GA4 and order data.
We track revenue alongside the ratio after a change. If a lower target brings more sales, we still compare the new ROAS with the break-even threshold. When margins differ, we check which products drive the total and do not count high revenue from a low-margin product as success on its own.
ROAS, POAS or MER?
We use ROAS for a product group with a known margin, POAS for products with different margins, and MER for efficiency across channels; the scope of the decision sets the metric.
Each case has its own answer:
- One product group with a known margin → we compare ROAS with break-even ROAS and track whether it meets the threshold.
- Products with very different margins → we evaluate with POAS, which divides the gross profit from advertising by ad spend.
- Several channels plus awareness spend → we track overall efficiency through MER, which compares total revenue with total marketing spend.
POAS stands for profit on ad spend. We compare products with different margins by the gross profit from advertising, not revenue alone, and in channel evaluations we state which costs are included. More guides on measurement and campaign decisions are collected on our English blog.
Frequently asked questions
What is ROAS?
ROAS is the ratio of revenue from advertising to ad spend. It shows how much revenue each dollar spent brings in.
How do you calculate ROAS?
We divide revenue from advertising by ad spend. For example, $40,000 revenue ÷ $10,000 spend = 4, a ROAS of 400%.
What is the difference between ROAS and ROI?
ROAS divides revenue by ad spend; ROI divides profit by total investment, subtracting total cost from revenue and dividing by total cost.
What is a good ROAS?
There is no single number; the break-even threshold from contribution margin and the target profit decide it. At a 40% contribution margin, break-even ROAS is 2.50.
What is POAS?
POAS is the ratio of gross profit from advertising to ad spend. We use it when evaluating products with different margins.
What is target ROAS?
Target ROAS is the conversion value we aim to earn per unit of ad spend. Google Ads bids toward it by predicting conversion value; it is entered as a percentage.

 How to advertise on YouTube: campaign types, targeting and costRead article
 What is advertising? How traditional and digital advertising worksRead article
 What is an audience in advertising? Audience types and how to chooseRead article
 Advertising on ChatGPT: Ads Manager, Targeting and Your First CampaignRead article
 How to advertise on Google: account, first campaign, budget, trackingRead article
 What are ads? How Google, Meta and ChatGPT ads work alikeRead article
 What is an ad library? Competitor ads on Meta, Google and TikTokRead article
 What is a buyer persona? How to create one, with a templateRead article
Questions & answers
0 commentsNo questions yet; you can ask the first one.